Email
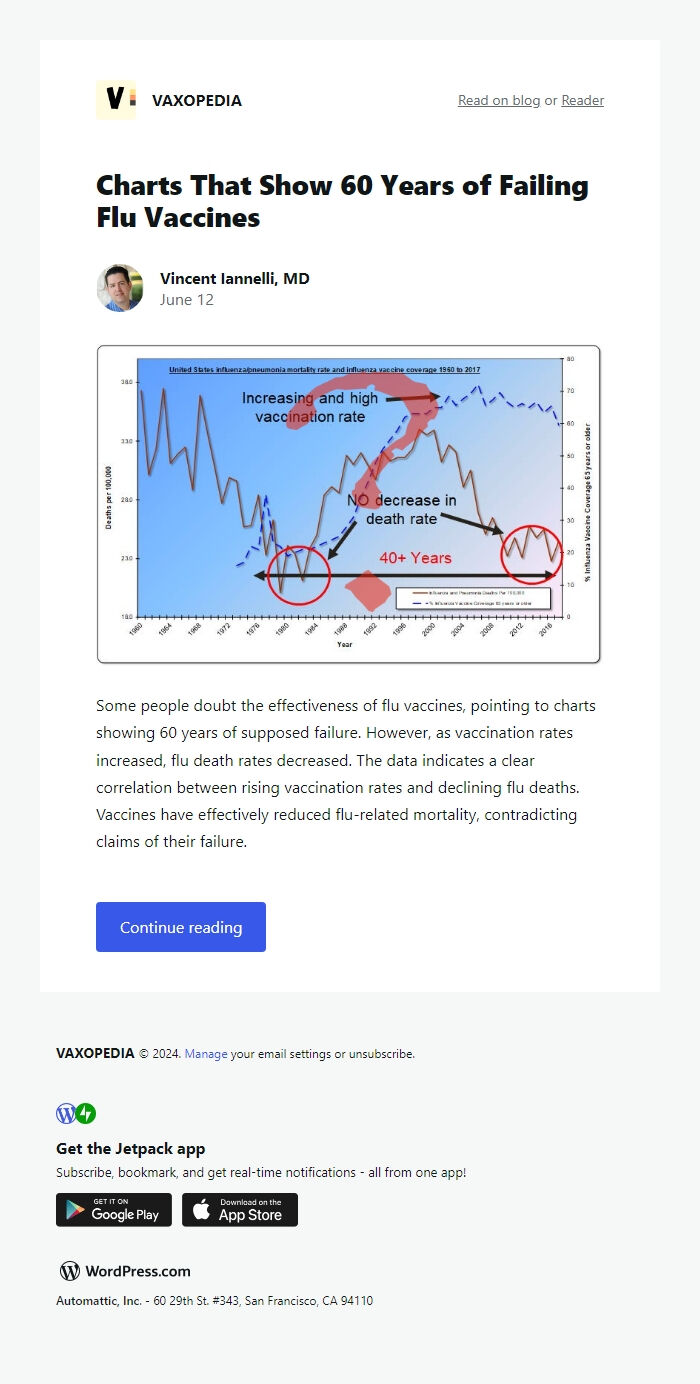
Charts That Show 60 Years of Failing Flu Vaccines
| From | VAXOPEDIA <[email protected]> |
| Subject | Charts That Show 60 Years of Failing Flu Vaccines |
| Date | June 13, 2024 1:03 AM |
Links have been removed from this email. Learn more in the FAQ.
Links have been removed from this email. Learn more in the FAQ.
Post : Charts That Show 60 Years of Failing Flu Vaccines
URL : [link removed]
Posted : June 12, 2024 at 7:02 pm
Author : Vincent Iannelli, MD
Tags : charts, flu deaths, flu vaccine myths, flu vaccine recommendations, mortality graphs, vaccines work
Categories : Vaccine Fact Check
Some people doubt the effectiveness of flu vaccines, pointing to charts showing 60 years of supposed failure. However, as vaccination rates increased, flu death rates decreased. The data indicates a clear correlation between rising vaccination rates and declining flu deaths. Vaccines have effectively reduced flu-related mortality, contradicting claims of their failure.
Read more of this post ( [link removed] )
--
Manage Subscriptions
[link removed]
Unsubscribe:
[link removed]
Message Analysis
- Sender: n/a
- Political Party: n/a
- Country: n/a
- State/Locality: n/a
- Office: n/a
-
Email Providers:
- Wordpress.com