Why do some people believe that flu vaccines don't work and that there are charts that show flu vaccines have been failing for 60 years? See the decrease in the flu death rate as the flu vaccination rate increased! The usual suspects... Charts…
Read on blog or Reader
Site logo image VAXOPEDIA Read on blog or Reader

Charts That Show 60 Years of Failing Flu Vaccines

Vincent Iannelli, MD

June 12

featured image

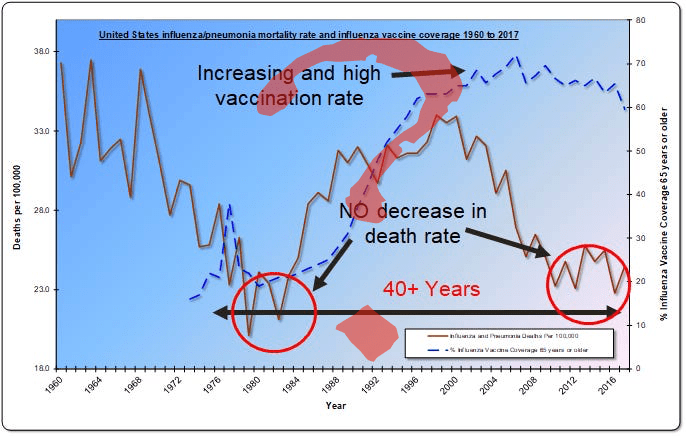
Some people doubt the effectiveness of flu vaccines, pointing to charts showing 60 years of supposed failure. However, as vaccination rates increased, flu death rates decreased. The data indicates a clear correlation between rising vaccination rates and declining flu deaths. Vaccines have effectively reduced flu-related mortality, contradicting claims of their failure.

Continue reading

VAXOPEDIA © 2024. Manage your email settings or unsubscribe.

WordPress.com and Jetpack Logos

Get the Jetpack app

Subscribe, bookmark, and get real-time notifications - all from one app!

Download Jetpack on Google Play Download Jetpack from the App Store
WordPress.com Logo and Wordmark title=

Automattic, Inc. - 60 29th St. #343, San Francisco, CA 94110