| From | Center for Jobs and the Economy <[email protected]> |
| Subject | California Trade Report for November 2022 |
| Date | January 6, 2023 4:00 PM |
Links have been removed from this email. Learn more in the FAQ.
Links have been removed from this email. Learn more in the FAQ.
Web Version [link removed] | Update Preferences [link removed] [link removed] California Trade Report
for November 2022
Below are highlights from the recently released trade data from the US Census Bureau and US Bureau of Economic Analysis. To view additional data and analysis related to the California economy visit our website at [[link removed]].
The November trade numbers saw a general decline as pandemic period patterns began to reverse and as China experienced continued lockdowns. Total trade through the state’s ports dropped both in nominal and real terms from November 2021, and was down in real terms compared to pre-pandemic November 2019. Origin exports were down 1.0% nominal (-3.5% real) from the prior year, and down 0.3% nominal (-12.2% real) from November 2019. Destination imports fell more sharply, down 10.6% (-12.9% real) from the prior year, but saw little change in real terms (down 2.5%) from November 2019.
The drop in trade activity was also seen in the continued easing in supply chain congestion. In their latest report, Marine Exchange of Southern California [[link removed]]indicates the San Pedro Bay ports have remained free of backups since November 22. The situation has in fact reversed with the ports now reporting open berths. Globally, similar easing has come from declining trade levels. The New York Federal Reserve’s Global Supply Chain Pressure Index remains somewhat elevated due to continued factors in Asia, but is down sharply from its peak in December 2021.
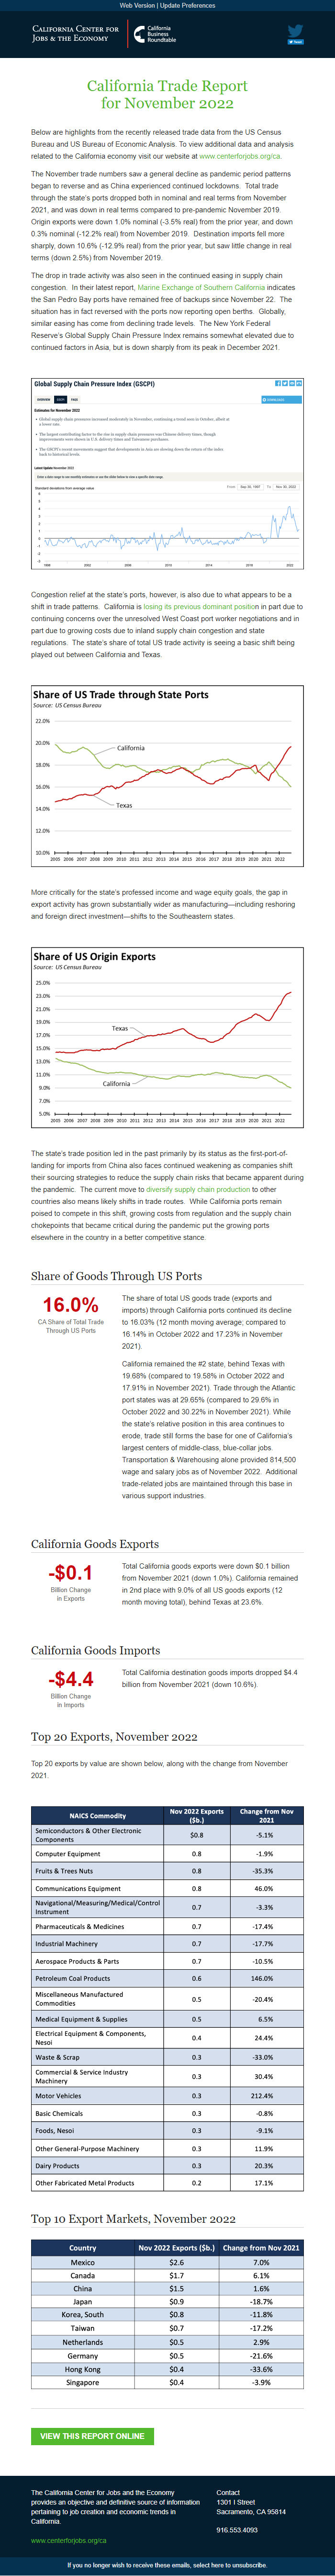
Congestion relief at the state’s ports, however, is also due to what appears to be a shift in trade patterns. California is losing its previous dominant positio [[link removed]]n in part due to continuing concerns over the unresolved West Coast port worker negotiations and in part due to growing costs due to inland supply chain congestion and state regulations. The state’s share of total US trade activity is seeing a basic shift being played out between California and Texas.
More critically for the state’s professed income and wage equity goals, the gap in export activity has grown substantially wider as manufacturing—including reshoring and foreign direct investment—shifts to the Southeastern states.
The state’s trade position led in the past primarily by its status as the first-port-of-landing for imports from China also faces continued weakening as companies shift their sourcing strategies to reduce the supply chain risks that became apparent during the pandemic. The current move to diversify supply chain production [[link removed]] to other countries also means likely shifts in trade routes. While California ports remain poised to compete in this shift, growing costs from regulation and the supply chain chokepoints that became critical during the pandemic put the growing ports elsewhere in the country in a better competitive stance.
Share of Goods Through US Ports 16.0% CA Share of Total Trade
Through US Ports
The share of total US goods trade (exports and imports) through California ports continued its decline to 16.03% (12 month moving average; compared to 16.14% in October 2022 and 17.23% in November 2021).
California remained the #2 state, behind Texas with 19.68% (compared to 19.58% in October 2022 and 17.91% in November 2021). Trade through the Atlantic port states was at 29.65% (compared to 29.6% in October 2022 and 30.22% in November 2021). While the state’s relative position in this area continues to erode, trade still forms the base for one of California’s largest centers of middle-class, blue-collar jobs. Transportation & Warehousing alone provided 814,500 wage and salary jobs as of November 2022. Additional trade-related jobs are maintained through this base in various support industries.
California Goods Exports -$0.1 Billion Change
in Exports
Total California goods exports were down $0.1 billion from November 2021 (down 1.0%). California remained in 2nd place with 9.0% of all US goods exports (12 month moving total), behind Texas at 23.6%.
California Goods Imports -$4.4 Billion Change
in Imports
Total California destination goods imports dropped $4.4 billion from November 2021 (down 10.6%).
Top 20 Exports, November 2022
Top 20 exports by value are shown below, along with the change from November 2021.
Top 10 Export Markets, November 2022 View This Report Online [[link removed]] The California Center for Jobs and the Economy provides an objective and definitive source of information pertaining to job creation and economic trends in California. [[link removed]] Contact 1301 I Street Sacramento, CA 95814 916.553.4093 If you no longer wish to receive these emails, select here to unsubscribe. [link removed]
for November 2022
Below are highlights from the recently released trade data from the US Census Bureau and US Bureau of Economic Analysis. To view additional data and analysis related to the California economy visit our website at [[link removed]].
The November trade numbers saw a general decline as pandemic period patterns began to reverse and as China experienced continued lockdowns. Total trade through the state’s ports dropped both in nominal and real terms from November 2021, and was down in real terms compared to pre-pandemic November 2019. Origin exports were down 1.0% nominal (-3.5% real) from the prior year, and down 0.3% nominal (-12.2% real) from November 2019. Destination imports fell more sharply, down 10.6% (-12.9% real) from the prior year, but saw little change in real terms (down 2.5%) from November 2019.
The drop in trade activity was also seen in the continued easing in supply chain congestion. In their latest report, Marine Exchange of Southern California [[link removed]]indicates the San Pedro Bay ports have remained free of backups since November 22. The situation has in fact reversed with the ports now reporting open berths. Globally, similar easing has come from declining trade levels. The New York Federal Reserve’s Global Supply Chain Pressure Index remains somewhat elevated due to continued factors in Asia, but is down sharply from its peak in December 2021.
Congestion relief at the state’s ports, however, is also due to what appears to be a shift in trade patterns. California is losing its previous dominant positio [[link removed]]n in part due to continuing concerns over the unresolved West Coast port worker negotiations and in part due to growing costs due to inland supply chain congestion and state regulations. The state’s share of total US trade activity is seeing a basic shift being played out between California and Texas.
More critically for the state’s professed income and wage equity goals, the gap in export activity has grown substantially wider as manufacturing—including reshoring and foreign direct investment—shifts to the Southeastern states.
The state’s trade position led in the past primarily by its status as the first-port-of-landing for imports from China also faces continued weakening as companies shift their sourcing strategies to reduce the supply chain risks that became apparent during the pandemic. The current move to diversify supply chain production [[link removed]] to other countries also means likely shifts in trade routes. While California ports remain poised to compete in this shift, growing costs from regulation and the supply chain chokepoints that became critical during the pandemic put the growing ports elsewhere in the country in a better competitive stance.
Share of Goods Through US Ports 16.0% CA Share of Total Trade
Through US Ports
The share of total US goods trade (exports and imports) through California ports continued its decline to 16.03% (12 month moving average; compared to 16.14% in October 2022 and 17.23% in November 2021).
California remained the #2 state, behind Texas with 19.68% (compared to 19.58% in October 2022 and 17.91% in November 2021). Trade through the Atlantic port states was at 29.65% (compared to 29.6% in October 2022 and 30.22% in November 2021). While the state’s relative position in this area continues to erode, trade still forms the base for one of California’s largest centers of middle-class, blue-collar jobs. Transportation & Warehousing alone provided 814,500 wage and salary jobs as of November 2022. Additional trade-related jobs are maintained through this base in various support industries.
California Goods Exports -$0.1 Billion Change
in Exports
Total California goods exports were down $0.1 billion from November 2021 (down 1.0%). California remained in 2nd place with 9.0% of all US goods exports (12 month moving total), behind Texas at 23.6%.
California Goods Imports -$4.4 Billion Change
in Imports
Total California destination goods imports dropped $4.4 billion from November 2021 (down 10.6%).
Top 20 Exports, November 2022
Top 20 exports by value are shown below, along with the change from November 2021.
Top 10 Export Markets, November 2022 View This Report Online [[link removed]] The California Center for Jobs and the Economy provides an objective and definitive source of information pertaining to job creation and economic trends in California. [[link removed]] Contact 1301 I Street Sacramento, CA 95814 916.553.4093 If you no longer wish to receive these emails, select here to unsubscribe. [link removed]
Message Analysis
- Sender: California Center for Jobs and the Economy
- Political Party: n/a
- Country: United States
- State/Locality: California
- Office: n/a
-
Email Providers:
- Campaign Monitor