| From | Center for Jobs and the Economy <[email protected]> |
| Subject | California Trade Report for November 2025 |
| Date | January 29, 2026 11:19 PM |
Links have been removed from this email. Learn more in the FAQ.
Links have been removed from this email. Learn more in the FAQ.
Web Version [link removed] | Update Preferences [link removed] [link removed] California Trade Report
for November 2025
Below are highlights from the recently released trade data from the US Census Bureau and US Bureau of Economic Analysis. To view additional data and analysis related to the California economy visit our website at [[link removed]].
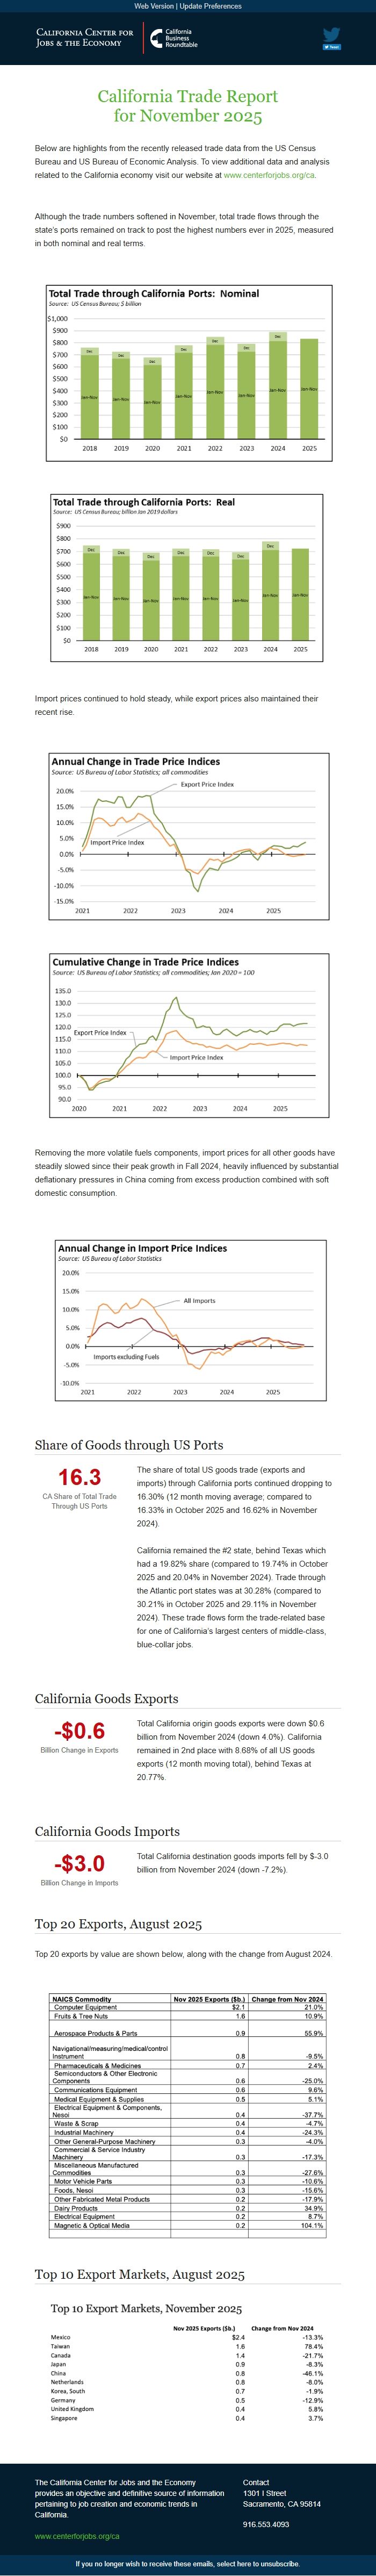
Although the trade numbers softened in November, total trade flows through the state’s ports remained on track to post the highest numbers ever in 2025, measured in both nominal and real terms.
Import prices continued to hold steady, while export prices also maintained their recent rise.
Removing the more volatile fuels components, import prices for all other goods have steadily slowed since their peak growth in Fall 2024, heavily influenced by substantial deflationary pressures in China coming from excess production combined with soft domestic consumption.
Share of Goods through US Ports 16.3 CA Share of Total Trade Through US Ports
The share of total US goods trade (exports and imports) through California ports continued dropping to 16.30% (12 month moving average; compared to 16.33% in October 2025 and 16.62% in November 2024).
California remained the #2 state, behind Texas which had a 19.82% share (compared to 19.74% in October 2025 and 20.04% in November 2024). Trade through the Atlantic port states was at 30.28% (compared to 30.21% in October 2025 and 29.11% in November 2024). These trade flows form the trade-related base for one of California’s largest centers of middle-class, blue-collar jobs.
California Goods Exports -$0.6 Billion Change in Exports
Total California origin goods exports were down $0.6 billion from November 2024 (down 4.0%). California remained in 2nd place with 8.68% of all US goods exports (12 month moving total), behind Texas at 20.77%.
California Goods Imports -$3.0 Billion Change in Imports
Total California destination goods imports fell by $-3.0 billion from November 2024 (down -7.2%).
Top 20 Exports, August 2025
Top 20 exports by value are shown below, along with the change from August 2024.
Top 10 Export Markets, August 2025 The California Center for Jobs and the Economy provides an objective and definitive source of information pertaining to job creation and economic trends in California. [[link removed]] Contact 1301 I Street Sacramento, CA 95814 916.553.4093 If you no longer wish to receive these emails, select here to unsubscribe. [link removed]
for November 2025
Below are highlights from the recently released trade data from the US Census Bureau and US Bureau of Economic Analysis. To view additional data and analysis related to the California economy visit our website at [[link removed]].
Although the trade numbers softened in November, total trade flows through the state’s ports remained on track to post the highest numbers ever in 2025, measured in both nominal and real terms.
Import prices continued to hold steady, while export prices also maintained their recent rise.
Removing the more volatile fuels components, import prices for all other goods have steadily slowed since their peak growth in Fall 2024, heavily influenced by substantial deflationary pressures in China coming from excess production combined with soft domestic consumption.
Share of Goods through US Ports 16.3 CA Share of Total Trade Through US Ports
The share of total US goods trade (exports and imports) through California ports continued dropping to 16.30% (12 month moving average; compared to 16.33% in October 2025 and 16.62% in November 2024).
California remained the #2 state, behind Texas which had a 19.82% share (compared to 19.74% in October 2025 and 20.04% in November 2024). Trade through the Atlantic port states was at 30.28% (compared to 30.21% in October 2025 and 29.11% in November 2024). These trade flows form the trade-related base for one of California’s largest centers of middle-class, blue-collar jobs.
California Goods Exports -$0.6 Billion Change in Exports
Total California origin goods exports were down $0.6 billion from November 2024 (down 4.0%). California remained in 2nd place with 8.68% of all US goods exports (12 month moving total), behind Texas at 20.77%.
California Goods Imports -$3.0 Billion Change in Imports
Total California destination goods imports fell by $-3.0 billion from November 2024 (down -7.2%).
Top 20 Exports, August 2025
Top 20 exports by value are shown below, along with the change from August 2024.
Top 10 Export Markets, August 2025 The California Center for Jobs and the Economy provides an objective and definitive source of information pertaining to job creation and economic trends in California. [[link removed]] Contact 1301 I Street Sacramento, CA 95814 916.553.4093 If you no longer wish to receive these emails, select here to unsubscribe. [link removed]
Message Analysis
- Sender: California Center for Jobs and the Economy
- Political Party: n/a
- Country: United States
- State/Locality: California
- Office: n/a
-
Email Providers:
- Campaign Monitor