Email
Today’s Huge Wealth Bubble: Can It Continue?
| From | Eugene Steuerle & The Government We Deserve <[email protected]> |
| Subject | Today’s Huge Wealth Bubble: Can It Continue? |
| Date | January 27, 2026 12:28 PM |
Links have been removed from this email. Learn more in the FAQ.
Links have been removed from this email. Learn more in the FAQ.
View this post on the web at [link removed]
Today, we are living in the middle of a massive wealth bubble. In my column today, I will explore the history of this bubble so far, how it connects to the current exceptionally high stock and real estate prices, and how this multi-decade bubble has left most people alive today with little exposure to normal or traditional market risks. In upcoming columns, I will examine possible causes and how this wealth bubble relates to wealth inequality. And no, I don’t have a clear way to tell you how to time your investments or fully diversify them to escape some overall investment risk that spreads across so many asset markets.
Today’s financial stories are probably familiar to you. The stock market reaches new highs [ [link removed] ], with a few stocks driving the gains, while recent dips are linked to events such as real or threatened military actions in Venezuela and Greenland. Many young adults cannot afford homes, and policy experts say a new “affordability” policy agenda, focused mainly on deregulation, will help address this issue. The Federal Reserve Board cuts interest rates to support higher employment, but President Trump says they should be cut further and has tried to reduce or eliminate the Board’s independence.
The Government We Deserve is a reader-supported publication. To receive new posts and support my work, consider becoming a free or paid subscriber.
Although these headlines, typically linked to some newsworthy current event, abound, most writers and pundits treat them as separate from each other and, more importantly, from a larger, longer-term pattern of wealth bubbling. A bigger story about the stock and real estate markets, as well as the debate over the Federal Reserve’s proper policy, is that we have not fully understood why this bubble has formed over recent decades or what might happen if it continues to swell, stays at current levels, or bursts.
In 2019, I published a study in the Journal of Business titled The Third Postwar Wealth Bubble [ [link removed] ]. It identified three successive postwar peaks in the nation’s ratio of household (and nonprofit) net worth to GDP in 1999, 2006, and 2019, with uncertainty about whether 2019 represented an ultimate peak or just another point on the way upward. Think of these peaks as intermittent bubbles within a larger, long-term bubble, or like peaks on the uphill side of a roller coaster. Each peak occurred just before a major economic disruption: the Dot-Com stock market crash in 2000, the Great Recession in 2007-9, and the COVID-19 crisis in 2020-2021. Data since 2019 shows still higher ratios and leaves unclear when the bubble identified in 2019 will peak.
Are we prepared for a downward slide on whatever peak that roller coaster may attain?
It’s common for markets to become frothy and then slightly collapse during economic crises. However, that’s not what I consider a peak here. What makes these peaks distinctive is that they consistently reach new highs compared to earlier post-World War II levels of market value relative to GDP, as asset prices grow faster than the national income. Additionally, it’s notable how quickly asset prices rebounded after a crisis. During the COVID-19 crisis, the decline in market value of all household assets was minimal and temporary.
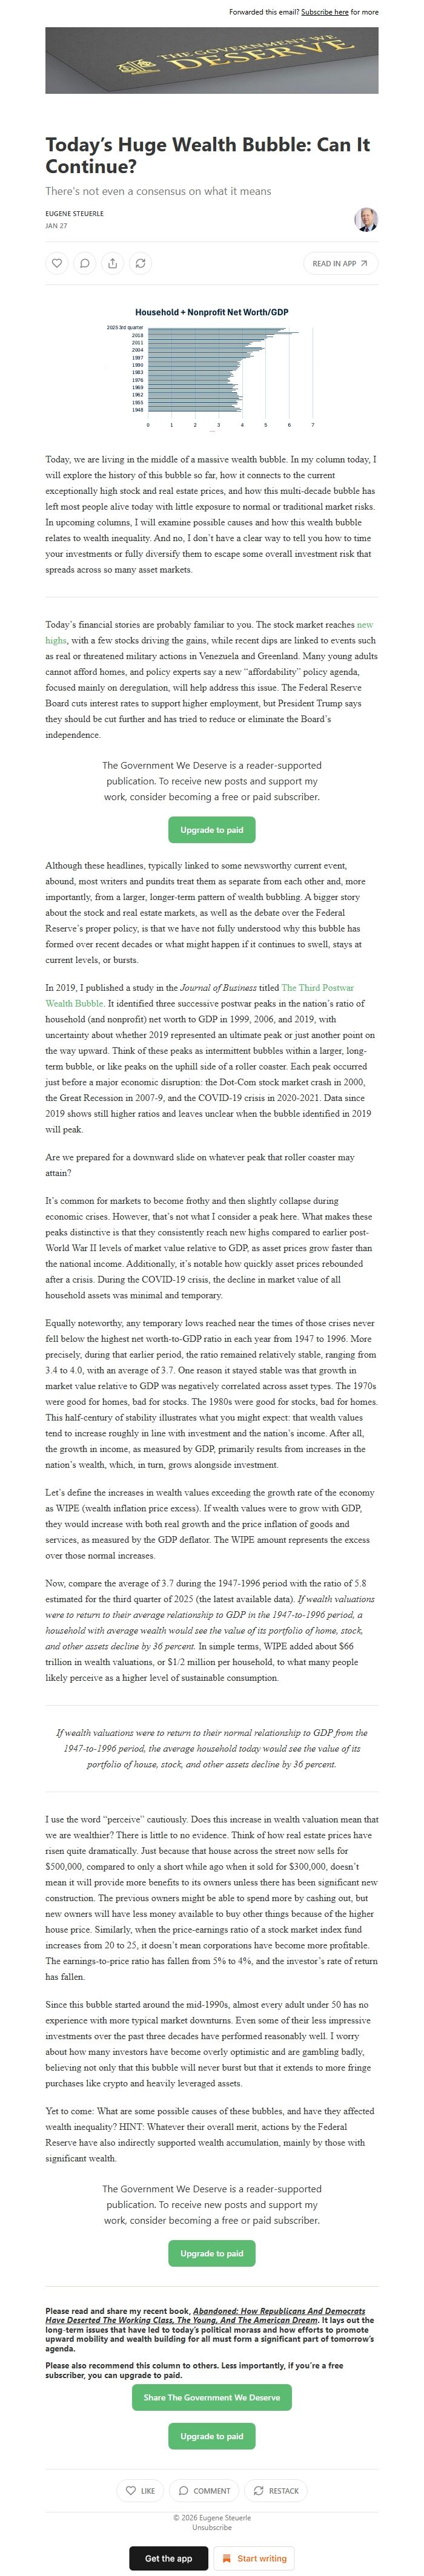
Equally noteworthy, any temporary lows reached near the times of those crises never fell below the highest net worth-to-GDP ratio in each year from 1947 to 1996. More precisely, during that earlier period, the ratio remained relatively stable, ranging from 3.4 to 4.0, with an average of 3.7. One reason it stayed stable was that growth in market value relative to GDP was negatively correlated across asset types. The 1970s were good for homes, bad for stocks. The 1980s were good for stocks, bad for homes. This half-century of stability illustrates what you might expect: that wealth values tend to increase roughly in line with investment and the nation’s income. After all, the growth in income, as measured by GDP, primarily results from increases in the nation’s wealth, which, in turn, grows alongside investment.
Let’s define the increases in wealth values exceeding the growth rate of the economy as WIPE (wealth inflation price excess). If wealth values were to grow with GDP, they would increase with both real growth and the price inflation of goods and services, as measured by the GDP deflator. The WIPE amount represents the excess over those normal increases.
Now, compare the average of 3.7 during the 1947-1996 period with the ratio of 5.8 estimated for the third quarter of 2025 (the latest available data). If wealth valuations were to return to their average relationship to GDP in the 1947-to-1996 period, a household with average wealth would see the value of its portfolio of home, stock, and other assets decline by 36 percent. In simple terms, WIPE added about $66 trillion in wealth valuations, or $1/2 million per household, to what many people likely perceive as a higher level of sustainable consumption.
If wealth valuations were to return to their normal relationship to GDP from the 1947-to-1996 period, the average household today would see the value of its portfolio of house, stock, and other assets decline by 36 percent.
I use the word “perceive” cautiously. Does this increase in wealth valuation mean that we are wealthier? There is little to no evidence. Think of how real estate prices have risen quite dramatically. Just because that house across the street now sells for $500,000, compared to only a short while ago when it sold for $300,000, doesn’t mean it will provide more benefits to its owners unless there has been significant new construction. The previous owners might be able to spend more by cashing out, but new owners will have less money available to buy other things because of the higher house price. Similarly, when the price-earnings ratio of a stock market index fund increases from 20 to 25, it doesn’t mean corporations have become more profitable. The earnings-to-price ratio has fallen from 5% to 4%, and the investor’s rate of return has fallen.
Since this bubble started around the mid-1990s, almost every adult under 50 has no experience with more typical market downturns. Even some of their less impressive investments over the past three decades have performed reasonably well. I worry about how many investors have become overly optimistic and are gambling badly, believing not only that this bubble will never burst but that it extends to more fringe purchases like crypto and heavily leveraged assets.
Yet to come: What are some possible causes of these bubbles, and have they affected wealth inequality? HINT: Whatever their overall merit, actions by the Federal Reserve have also indirectly supported wealth accumulation, mainly by those with significant wealth.
The Government We Deserve is a reader-supported publication. To receive new posts and support my work, consider becoming a free or paid subscriber.
Unsubscribe [link removed]?
Today, we are living in the middle of a massive wealth bubble. In my column today, I will explore the history of this bubble so far, how it connects to the current exceptionally high stock and real estate prices, and how this multi-decade bubble has left most people alive today with little exposure to normal or traditional market risks. In upcoming columns, I will examine possible causes and how this wealth bubble relates to wealth inequality. And no, I don’t have a clear way to tell you how to time your investments or fully diversify them to escape some overall investment risk that spreads across so many asset markets.
Today’s financial stories are probably familiar to you. The stock market reaches new highs [ [link removed] ], with a few stocks driving the gains, while recent dips are linked to events such as real or threatened military actions in Venezuela and Greenland. Many young adults cannot afford homes, and policy experts say a new “affordability” policy agenda, focused mainly on deregulation, will help address this issue. The Federal Reserve Board cuts interest rates to support higher employment, but President Trump says they should be cut further and has tried to reduce or eliminate the Board’s independence.
The Government We Deserve is a reader-supported publication. To receive new posts and support my work, consider becoming a free or paid subscriber.
Although these headlines, typically linked to some newsworthy current event, abound, most writers and pundits treat them as separate from each other and, more importantly, from a larger, longer-term pattern of wealth bubbling. A bigger story about the stock and real estate markets, as well as the debate over the Federal Reserve’s proper policy, is that we have not fully understood why this bubble has formed over recent decades or what might happen if it continues to swell, stays at current levels, or bursts.
In 2019, I published a study in the Journal of Business titled The Third Postwar Wealth Bubble [ [link removed] ]. It identified three successive postwar peaks in the nation’s ratio of household (and nonprofit) net worth to GDP in 1999, 2006, and 2019, with uncertainty about whether 2019 represented an ultimate peak or just another point on the way upward. Think of these peaks as intermittent bubbles within a larger, long-term bubble, or like peaks on the uphill side of a roller coaster. Each peak occurred just before a major economic disruption: the Dot-Com stock market crash in 2000, the Great Recession in 2007-9, and the COVID-19 crisis in 2020-2021. Data since 2019 shows still higher ratios and leaves unclear when the bubble identified in 2019 will peak.
Are we prepared for a downward slide on whatever peak that roller coaster may attain?
It’s common for markets to become frothy and then slightly collapse during economic crises. However, that’s not what I consider a peak here. What makes these peaks distinctive is that they consistently reach new highs compared to earlier post-World War II levels of market value relative to GDP, as asset prices grow faster than the national income. Additionally, it’s notable how quickly asset prices rebounded after a crisis. During the COVID-19 crisis, the decline in market value of all household assets was minimal and temporary.
Equally noteworthy, any temporary lows reached near the times of those crises never fell below the highest net worth-to-GDP ratio in each year from 1947 to 1996. More precisely, during that earlier period, the ratio remained relatively stable, ranging from 3.4 to 4.0, with an average of 3.7. One reason it stayed stable was that growth in market value relative to GDP was negatively correlated across asset types. The 1970s were good for homes, bad for stocks. The 1980s were good for stocks, bad for homes. This half-century of stability illustrates what you might expect: that wealth values tend to increase roughly in line with investment and the nation’s income. After all, the growth in income, as measured by GDP, primarily results from increases in the nation’s wealth, which, in turn, grows alongside investment.
Let’s define the increases in wealth values exceeding the growth rate of the economy as WIPE (wealth inflation price excess). If wealth values were to grow with GDP, they would increase with both real growth and the price inflation of goods and services, as measured by the GDP deflator. The WIPE amount represents the excess over those normal increases.
Now, compare the average of 3.7 during the 1947-1996 period with the ratio of 5.8 estimated for the third quarter of 2025 (the latest available data). If wealth valuations were to return to their average relationship to GDP in the 1947-to-1996 period, a household with average wealth would see the value of its portfolio of home, stock, and other assets decline by 36 percent. In simple terms, WIPE added about $66 trillion in wealth valuations, or $1/2 million per household, to what many people likely perceive as a higher level of sustainable consumption.
If wealth valuations were to return to their normal relationship to GDP from the 1947-to-1996 period, the average household today would see the value of its portfolio of house, stock, and other assets decline by 36 percent.
I use the word “perceive” cautiously. Does this increase in wealth valuation mean that we are wealthier? There is little to no evidence. Think of how real estate prices have risen quite dramatically. Just because that house across the street now sells for $500,000, compared to only a short while ago when it sold for $300,000, doesn’t mean it will provide more benefits to its owners unless there has been significant new construction. The previous owners might be able to spend more by cashing out, but new owners will have less money available to buy other things because of the higher house price. Similarly, when the price-earnings ratio of a stock market index fund increases from 20 to 25, it doesn’t mean corporations have become more profitable. The earnings-to-price ratio has fallen from 5% to 4%, and the investor’s rate of return has fallen.
Since this bubble started around the mid-1990s, almost every adult under 50 has no experience with more typical market downturns. Even some of their less impressive investments over the past three decades have performed reasonably well. I worry about how many investors have become overly optimistic and are gambling badly, believing not only that this bubble will never burst but that it extends to more fringe purchases like crypto and heavily leveraged assets.
Yet to come: What are some possible causes of these bubbles, and have they affected wealth inequality? HINT: Whatever their overall merit, actions by the Federal Reserve have also indirectly supported wealth accumulation, mainly by those with significant wealth.
The Government We Deserve is a reader-supported publication. To receive new posts and support my work, consider becoming a free or paid subscriber.
Unsubscribe [link removed]?
Message Analysis
- Sender: n/a
- Political Party: n/a
- Country: n/a
- State/Locality: n/a
- Office: n/a