|
|
|
|
|
|
|
Money Metals News Alert
|
December 8, 2025
– Silver prices moved higher again last week, closing Friday at a whopping
$58.55 an ounce. Gold finished the week slightly lower.
|
|
|
Stocks finished higher,
bond prices fell and the U.S. dollar declined relative to other major currencies.
With significant retail
selling of silver, refining capacity is booked out months. In fact, many refiners
have stopped bidding for metal such as 90% U.S. coins. This is driving bid and ask
premiums lower on these common silver coins.
|
|
|
|
Investors can now purchase silver, at
least in the form of 90% U.S. coins, below the spot price for the metal. Money
Metals has them for sale at 50
cents under spot!
|
|
|

|
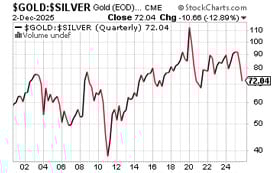
Gold : Silver Ratio (as of
Friday's closing prices) – 71.9 to
1
|
|
|
|
|
|
|
Silver prices are surging toward $60
dollars an ounce. The white metal finally broke out to new all-time highs two
months ago -- at least without adjusting for inflation.
|
|
|
The average gold:silver
ratio based on the adjacent chart is 72, meaning it took 72 ounces of silver to
buy one ounce of gold.
The average skewed
significantly based on the six years between 2018 and 2024, an unusual period
where silver prices generally languished relative to gold.
|
|
|
|
The ratio average between 1975 and
1990 was 55. Between 1991 and 2005, the average was 65. With the gold/silver ratio
at 72 now, silver is still cheap relative to gold on a historical basis.
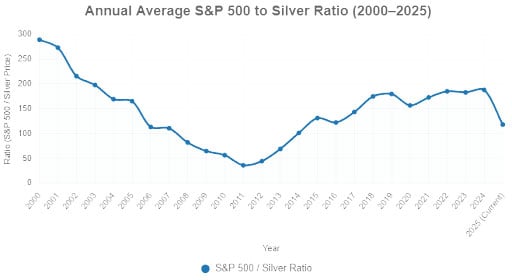
Let???s now compare silver to the value
of U.S. equities.. Below is a chart which shows the ratio of the S&P 500 to the
silver price since the year 2000. The ratio began at nearly 300 ozs of silver to
equal the value of the stock index. It then declined to below 50 when silver
prices peaked in 2011.
In recent years, this ratio hovered
near 180. But silver has dramatically outperformed the index in 2025 and currently
resides near 118.
|
|
|
|
|
The ratio average for this time period
is 146. This year???s performance means silver is more expensive than the average,
but it remains well below the 2011 peak in value versus stocks.
The average for the past 50 years is
103, so silver still looks cheap based on the longer time frame.
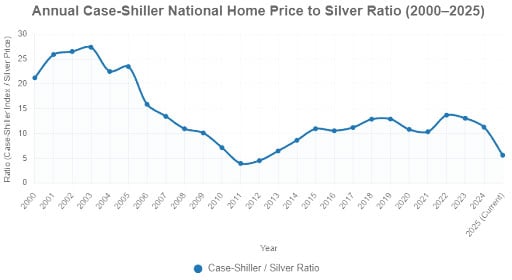
Now let???s take a look at silver prices
versus the price of residential real estate. The chart below plots average annual
silver prices versus the year-end Case-Shiller National Home Price Index for each
year.
|
|
|
|
|
Silver is close to the 2011 peak in
value versus single family home values. Based on data from the past 25 years, it
would be fair to say silver is getting expensive relative to residential real
estate.
Of course, the steady erosion in the
purchasing power of the Federal Reserve note dollar has been a fundamental driver
for both home prices and silver prices. Thus far at least, silver has proven to be
the better hedge against inflation.
That may continue given that home
affordability is at historic lows. Fewer Americans can afford the price of entry
into home ownership. But they can still buy silver.
|
|
|
|
|
|
|
|
This week's Market Update was
authored by Money Metals Director Clint Siegner.
|
|
|
|
|
|
|
|
|
|
This copyrighted material may not
be republished without express permission. Offer only available through email
promotion. Offer does not apply to previous orders and may not be combined with
any other offer or program. Special shipping rates or other restrictions may apply
to international orders. The information presented here is for general educational
purposes only. Money Metals Exchange and its staff do not act as personal
investment advisors. Nor do we advocate the purchase or sale of any regulated
security listed on any exchange for any specific individual. While our track
record is excellent, investment markets have inherent risks and there can be no
assurance of future profits. You are responsible for your investment decisions,
and they should be made in consultation with your own advisors. By purchasing from
Money Metals, you understand our company is not responsible for any losses caused
by your investment decisions, nor do we have any claim to any market gains you may
enjoy. Money Metals Exchange is not a regulated trading ???exchange??? as defined by
the CFTC and the SEC.
|
|
|