Email
What Is Happening To Employment?
| From | Eugene Steuerle & The Government We Deserve <[email protected]> |
| Subject | What Is Happening To Employment? |
| Date | September 6, 2025 12:41 PM |
Links have been removed from this email. Learn more in the FAQ.
Links have been removed from this email. Learn more in the FAQ.
View this post on the web at [link removed]
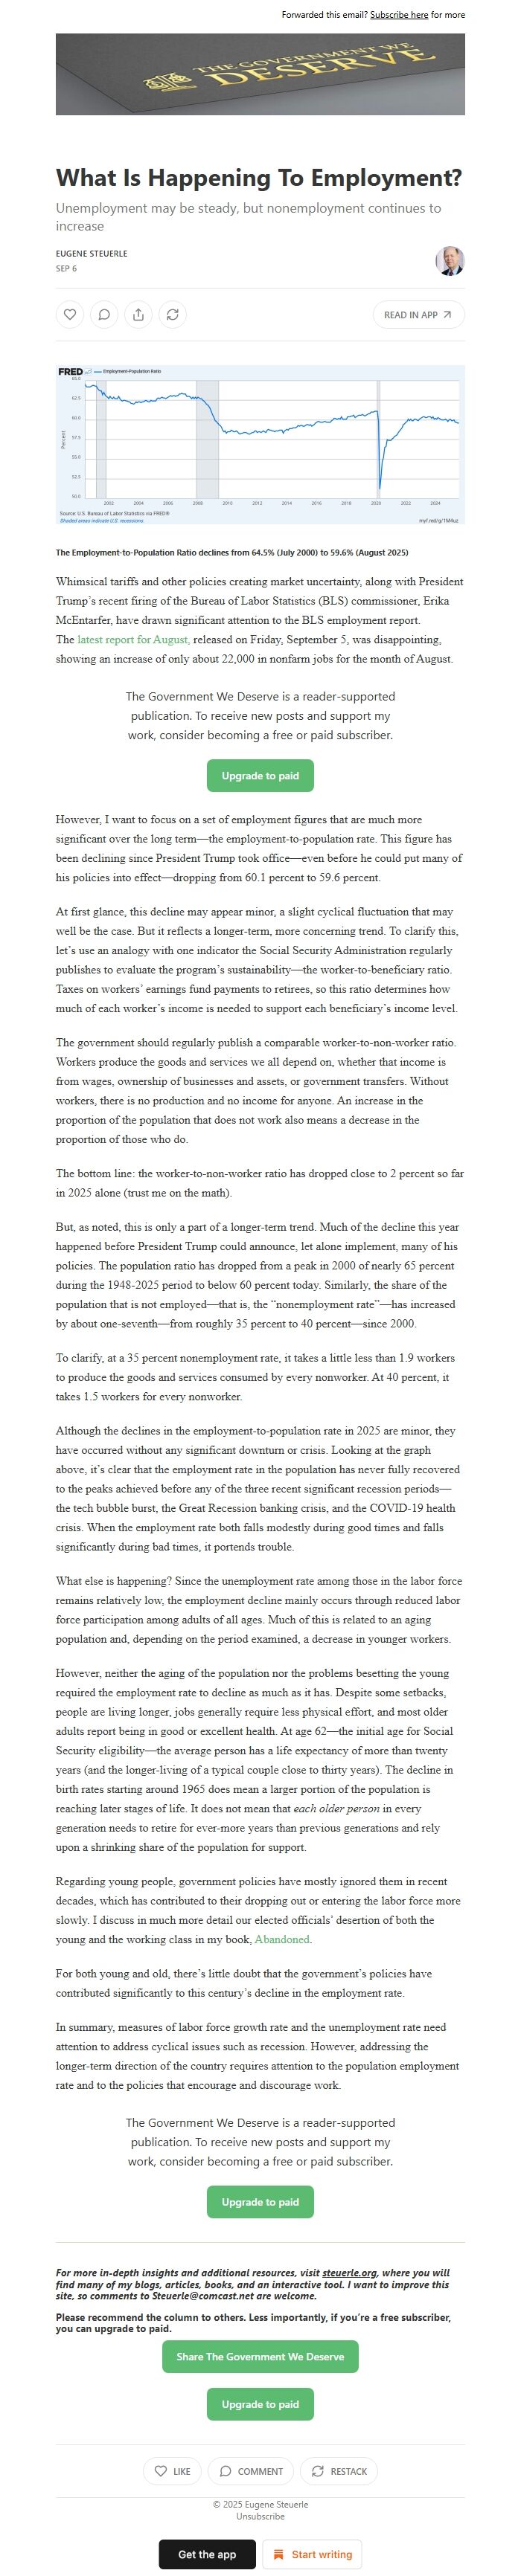
The Employment-to-Population Ratio declines from 64.5% (July 2000) to 59.6% (August 2025)
Whimsical tariffs and other policies creating market uncertainty, along with President Trump’s recent firing of the Bureau of Labor Statistics (BLS) commissioner, Erika McEntarfer, have drawn significant attention to the BLS employment report. The latest report for August, [ [link removed] ] released on Friday, September 5, was disappointing, showing an increase of only about 22,000 in nonfarm jobs for the month of August.
The Government We Deserve is a reader-supported publication. To receive new posts and support my work, consider becoming a free or paid subscriber.
However, I want to focus on a set of employment figures that are much more significant over the long term—the employment-to-population rate. This figure has been declining since President Trump took office—even before he could put many of his policies into effect—dropping from 60.1 percent to 59.6 percent.
At first glance, this decline may appear minor, a slight cyclical fluctuation that may well be the case. But it reflects a longer-term, more concerning trend. To clarify this, let’s use an analogy with one indicator the Social Security Administration regularly publishes to evaluate the program’s sustainability—the worker-to-beneficiary ratio. Taxes on workers’ earnings fund payments to retirees, so this ratio determines how much of each worker’s income is needed to support each beneficiary’s income level.
The government should regularly publish a comparable worker-to-non-worker ratio. Workers produce the goods and services we all depend on, whether that income is from wages, ownership of businesses and assets, or government transfers. Without workers, there is no production and no income for anyone. An increase in the proportion of the population that does not work also means a decrease in the proportion of those who do.
The bottom line: the worker-to-non-worker ratio has dropped close to 2 percent so far in 2025 alone (trust me on the math).
But, as noted, this is only a part of a longer-term trend. Much of the decline this year happened before President Trump could announce, let alone implement, many of his policies. The population ratio has dropped from a peak in 2000 of nearly 65 percent during the 1948-2025 period to below 60 percent today. Similarly, the share of the population that is not employed—that is, the “nonemployment rate”—has increased by about one-seventh—from roughly 35 percent to 40 percent—since 2000.
To clarify, at a 35 percent nonemployment rate, it takes a little less than 1.9 workers to produce the goods and services consumed by every nonworker. At 40 percent, it takes 1.5 workers for every nonworker.
Although the declines in the employment-to-population rate in 2025 are minor, they have occurred without any significant downturn or crisis. Looking at the graph above, it’s clear that the employment rate in the population has never fully recovered to the peaks achieved before any of the three recent significant recession periods—the tech bubble burst, the Great Recession banking crisis, and the COVID-19 health crisis. When the employment rate both falls modestly during good times and falls significantly during bad times, it portends trouble.
What else is happening? Since the unemployment rate among those in the labor force remains relatively low, the employment decline mainly occurs through reduced labor force participation among adults of all ages. Much of this is related to an aging population and, depending on the period examined, a decrease in younger workers.
However, neither the aging of the population nor the problems besetting the young required the employment rate to decline as much as it has. Despite some setbacks, people are living longer, jobs generally require less physical effort, and most older adults report being in good or excellent health. At age 62—the initial age for Social Security eligibility—the average person has a life expectancy of more than twenty years (and the longer-living of a typical couple close to thirty years). The decline in birth rates starting around 1965 does mean a larger portion of the population is reaching later stages of life. It does not mean that each older person in every generation needs to retire for ever-more years than previous generations and rely upon a shrinking share of the population for support.
Regarding young people, government policies have mostly ignored them in recent decades, which has contributed to their dropping out or entering the labor force more slowly. I discuss in much more detail our elected officials’ desertion of both the young and the working class in my book, Abandoned [ [link removed] ].
For both young and old, there’s little doubt that the government’s policies have contributed significantly to this century’s decline in the employment rate.
In summary, measures of labor force growth rate and the unemployment rate need attention to address cyclical issues such as recession. However, addressing the longer-term direction of the country requires attention to the population employment rate and to the policies that encourage and discourage work.
The Government We Deserve is a reader-supported publication. To receive new posts and support my work, consider becoming a free or paid subscriber.
Unsubscribe [link removed]?
Message Analysis
- Sender: n/a
- Political Party: n/a
- Country: n/a
- State/Locality: n/a
- Office: n/a