| From | Center for Jobs and the Economy <[email protected]> |
| Subject | California Trade Report for February 2025 |
| Date | April 3, 2025 9:52 PM |
Links have been removed from this email. Learn more in the FAQ.
Links have been removed from this email. Learn more in the FAQ.
Web Version [link removed] | Update Preferences [link removed] [link removed] California Trade Report
for February 2025
Below are highlights from the recently released trade data from the US Census Bureau and US Bureau of Economic Analysis. To view additional data and analysis related to the California economy visit our website at www.centerforjobs.org/ca [[link removed]].
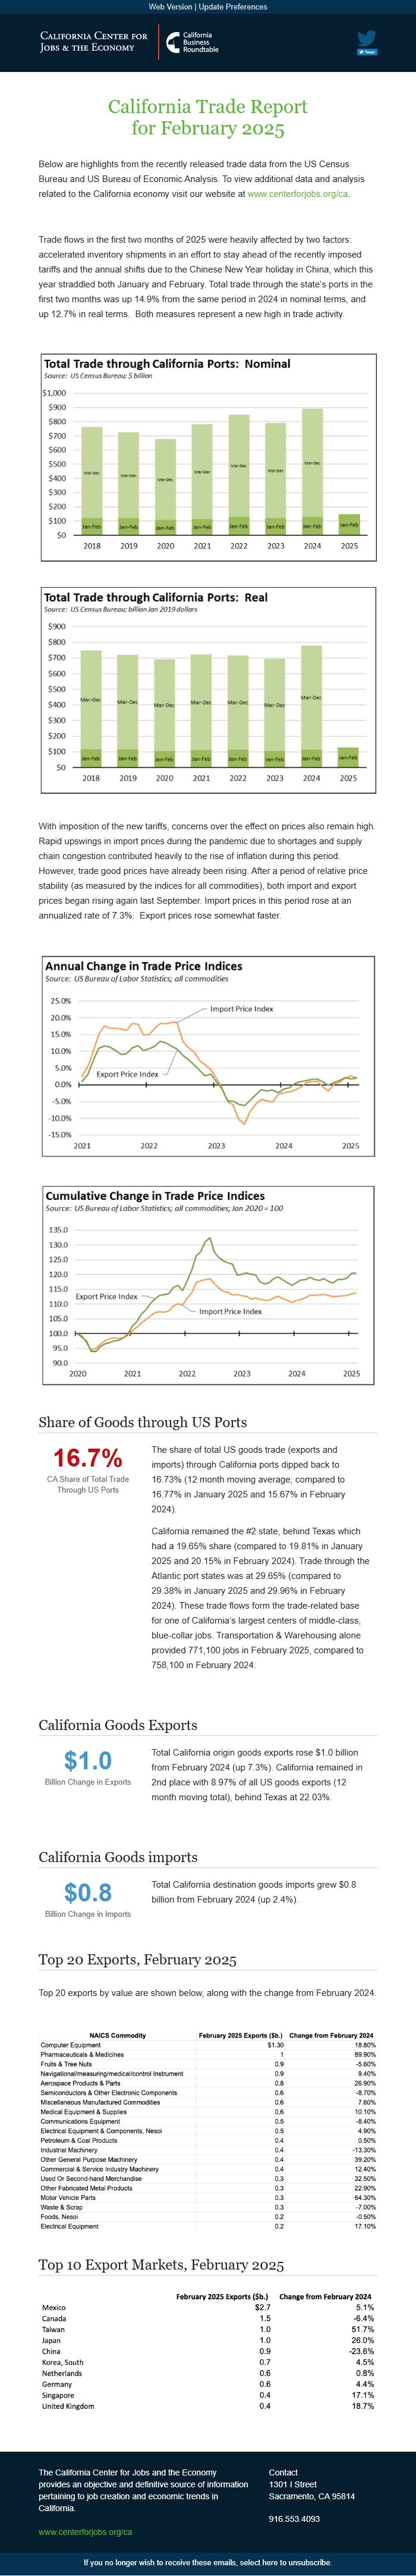
Trade flows in the first two months of 2025 were heavily affected by two factors: accelerated inventory shipments in an effort to stay ahead of the recently imposed tariffs and the annual shifts due to the Chinese New Year holiday in China, which this year straddled both January and February. Total trade through the state’s ports in the first two months was up 14.9% from the same period in 2024 in nominal terms, and up 12.7% in real terms. Both measures represent a new high in trade activity.
With imposition of the new tariffs, concerns over the effect on prices also remain high. Rapid upswings in import prices during the pandemic due to shortages and supply chain congestion contributed heavily to the rise of inflation during this period. However, trade good prices have already been rising. After a period of relative price stability (as measured by the indices for all commodities), both import and export prices began rising again last September. Import prices in this period rose at an annualized rate of 7.3%. Export prices rose somewhat faster.
Share of Goods through US Ports 16.7% CA Share of Total Trade Through US Ports
The share of total US goods trade (exports and imports) through California ports dipped back to 16.73% (12 month moving average; compared to 16.77% in January 2025 and 15.67% in February 2024).
California remained the #2 state, behind Texas which had a 19.65% share (compared to 19.81% in January 2025 and 20.15% in February 2024). Trade through the Atlantic port states was at 29.65% (compared to 29.38% in January 2025 and 29.96% in February 2024). These trade flows form the trade-related base for one of California’s largest centers of middle-class, blue-collar jobs. Transportation & Warehousing alone provided 771,100 jobs in February 2025, compared to 758,100 in February 2024.
California Goods Exports $1.0 Billion Change in Exports
Total California origin goods exports rose $1.0 billion from February 2024 (up 7.3%). California remained in 2nd place with 8.97% of all US goods exports (12 month moving total), behind Texas at 22.03%.
California Goods imports $0.8 Billion Change in Imports
Total California destination goods imports grew $0.8 billion from February 2024 (up 2.4%).
Top 20 Exports, February 2025
Top 20 exports by value are shown below, along with the change from February 2024.
Top 10 Export Markets, February 2025 The California Center for Jobs and the Economy provides an objective and definitive source of information pertaining to job creation and economic trends in California. [[link removed]] Contact 1301 I Street Sacramento, CA 95814 916.553.4093 If you no longer wish to receive these emails, select here to unsubscribe. [link removed]
for February 2025
Below are highlights from the recently released trade data from the US Census Bureau and US Bureau of Economic Analysis. To view additional data and analysis related to the California economy visit our website at www.centerforjobs.org/ca [[link removed]].
Trade flows in the first two months of 2025 were heavily affected by two factors: accelerated inventory shipments in an effort to stay ahead of the recently imposed tariffs and the annual shifts due to the Chinese New Year holiday in China, which this year straddled both January and February. Total trade through the state’s ports in the first two months was up 14.9% from the same period in 2024 in nominal terms, and up 12.7% in real terms. Both measures represent a new high in trade activity.
With imposition of the new tariffs, concerns over the effect on prices also remain high. Rapid upswings in import prices during the pandemic due to shortages and supply chain congestion contributed heavily to the rise of inflation during this period. However, trade good prices have already been rising. After a period of relative price stability (as measured by the indices for all commodities), both import and export prices began rising again last September. Import prices in this period rose at an annualized rate of 7.3%. Export prices rose somewhat faster.
Share of Goods through US Ports 16.7% CA Share of Total Trade Through US Ports
The share of total US goods trade (exports and imports) through California ports dipped back to 16.73% (12 month moving average; compared to 16.77% in January 2025 and 15.67% in February 2024).
California remained the #2 state, behind Texas which had a 19.65% share (compared to 19.81% in January 2025 and 20.15% in February 2024). Trade through the Atlantic port states was at 29.65% (compared to 29.38% in January 2025 and 29.96% in February 2024). These trade flows form the trade-related base for one of California’s largest centers of middle-class, blue-collar jobs. Transportation & Warehousing alone provided 771,100 jobs in February 2025, compared to 758,100 in February 2024.
California Goods Exports $1.0 Billion Change in Exports
Total California origin goods exports rose $1.0 billion from February 2024 (up 7.3%). California remained in 2nd place with 8.97% of all US goods exports (12 month moving total), behind Texas at 22.03%.
California Goods imports $0.8 Billion Change in Imports
Total California destination goods imports grew $0.8 billion from February 2024 (up 2.4%).
Top 20 Exports, February 2025
Top 20 exports by value are shown below, along with the change from February 2024.
Top 10 Export Markets, February 2025 The California Center for Jobs and the Economy provides an objective and definitive source of information pertaining to job creation and economic trends in California. [[link removed]] Contact 1301 I Street Sacramento, CA 95814 916.553.4093 If you no longer wish to receive these emails, select here to unsubscribe. [link removed]
Message Analysis
- Sender: California Center for Jobs and the Economy
- Political Party: n/a
- Country: United States
- State/Locality: California
- Office: n/a
-
Email Providers:
- Campaign Monitor