Email
QUICK FACTS: California Employment Report for January 2024
| From | Center for Jobs and the Economy <[email protected]> |
| Subject | QUICK FACTS: California Employment Report for January 2024 |
| Date | March 8, 2024 11:20 PM |
Links have been removed from this email. Learn more in the FAQ.
Links have been removed from this email. Learn more in the FAQ.
Web Version [link removed] | Update Preferences [link removed] [link removed] QUICK FACTS: California Employment Report for January 2024
The Center for Jobs and the Economy has released our initial analysis of the January Employment Report from the California Employment Development Department. The additional information we generally address from US Bureau of Labor Statistics will not be released until Monday, at which time we will do a more complete analysis in our Full Jobs Report. For additional information and data about the California economy visit www.centerforjobs.org/ca [[link removed]].
On a data note, the annual data revision process continues with this release and will continue with the February numbers to be released in two weeks. In addition, with this report, we are resuming the employment and unemployment estimates by legislative district. The estimate methodology and previous months results are available on the Center’s website.
Recovery 232,000 Jobs Weaker than Previously Reported
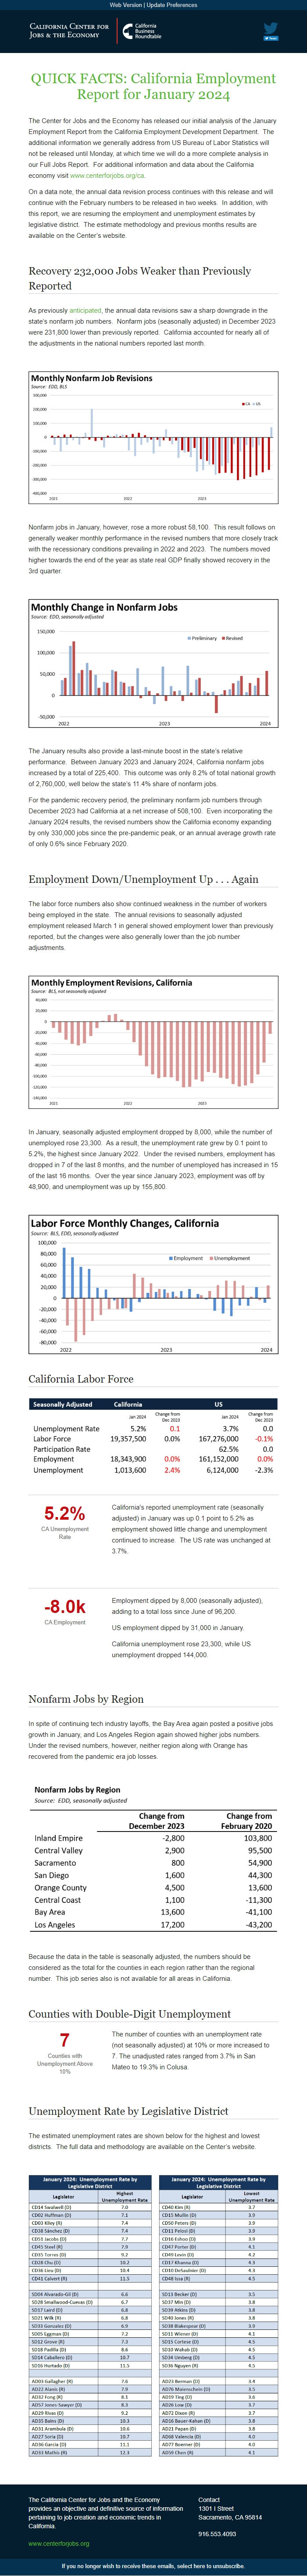
As previously anticipated [[link removed]], the annual data revisions saw a sharp downgrade in the state’s nonfarm job numbers. Nonfarm jobs (seasonally adjusted) in December 2023 were 231,800 lower than previously reported. California accounted for nearly all of the adjustments in the national numbers reported last month.
Nonfarm jobs in January, however, rose a more robust 58,100. This result follows on generally weaker monthly performance in the revised numbers that more closely track with the recessionary conditions prevailing in 2022 and 2023. The numbers moved higher towards the end of the year as state real GDP finally showed recovery in the 3rd quarter.
The January results also provide a last-minute boost in the state’s relative performance. Between January 2023 and January 2024, California nonfarm jobs increased by a total of 225,400. This outcome was only 8.2% of total national growth of 2,760,000, well below the state’s 11.4% share of nonfarm jobs.
For the pandemic recovery period, the preliminary nonfarm job numbers through December 2023 had California at a net increase of 508,100. Even incorporating the January 2024 results, the revised numbers show the California economy expanding by only 330,000 jobs since the pre-pandemic peak, or an annual average growth rate of only 0.6% since February 2020.
Employment Down/Unemployment Up . . . Again
The labor force numbers also show continued weakness in the number of workers being employed in the state. The annual revisions to seasonally adjusted employment released March 1 in general showed employment lower than previously reported, but the changes were also generally lower than the job number adjustments.
In January, seasonally adjusted employment dropped by 8,000, while the number of unemployed rose 23,300. As a result, the unemployment rate grew by 0.1 point to 5.2%, the highest since January 2022. Under the revised numbers, employment has dropped in 7 of the last 8 months, and the number of unemployed has increased in 15 of the last 16 months. Over the year since January 2023, employment was off by 48,900, and unemployment was up by 155,800.
California Labor Force 5.2% CA Unemployment
Rate
California's reported unemployment rate (seasonally adjusted) in January was up 0.1 point to 5.2% as employment showed little change and unemployment continued to increase. The US rate was unchanged at 3.7%.
-8.0k CA Employment
Employment dipped by 8,000 (seasonally adjusted), adding to a total loss since June of 96,200.
US employment dipped by 31,000 in January.
California unemployment rose 23,300, while US unemployment dropped 144,000.
Nonfarm Jobs by Region
In spite of continuing tech industry layoffs, the Bay Area again posted a positive jobs growth in January, and Los Angeles Region again showed higher jobs numbers. Under the revised numbers, however, neither region along with Orange has recovered from the pandemic era job losses.
Because the data in the table is seasonally adjusted, the numbers should be considered as the total for the counties in each region rather than the regional number. This job series also is not available for all areas in California.
Counties with Double-Digit Unemployment 7 Counties with
Unemployment Above
10%
The number of counties with an unemployment rate (not seasonally adjusted) at 10% or more increased to 7. The unadjusted rates ranged from 3.7% in San Mateo to 19.3% in Colusa.
Unemployment Rate by Legislative District
The estimated unemployment rates are shown below for the highest and lowest districts. The full data and methodology are available on the Center’s website.
The California Center for Jobs and the Economy provides an objective and definitive source of information pertaining to job creation and economic trends in California. [[link removed]] Contact 1301 I Street Sacramento, CA 95814 916.553.4093 If you no longer wish to receive these emails, select here to unsubscribe. [link removed]
The Center for Jobs and the Economy has released our initial analysis of the January Employment Report from the California Employment Development Department. The additional information we generally address from US Bureau of Labor Statistics will not be released until Monday, at which time we will do a more complete analysis in our Full Jobs Report. For additional information and data about the California economy visit www.centerforjobs.org/ca [[link removed]].
On a data note, the annual data revision process continues with this release and will continue with the February numbers to be released in two weeks. In addition, with this report, we are resuming the employment and unemployment estimates by legislative district. The estimate methodology and previous months results are available on the Center’s website.
Recovery 232,000 Jobs Weaker than Previously Reported
As previously anticipated [[link removed]], the annual data revisions saw a sharp downgrade in the state’s nonfarm job numbers. Nonfarm jobs (seasonally adjusted) in December 2023 were 231,800 lower than previously reported. California accounted for nearly all of the adjustments in the national numbers reported last month.
Nonfarm jobs in January, however, rose a more robust 58,100. This result follows on generally weaker monthly performance in the revised numbers that more closely track with the recessionary conditions prevailing in 2022 and 2023. The numbers moved higher towards the end of the year as state real GDP finally showed recovery in the 3rd quarter.
The January results also provide a last-minute boost in the state’s relative performance. Between January 2023 and January 2024, California nonfarm jobs increased by a total of 225,400. This outcome was only 8.2% of total national growth of 2,760,000, well below the state’s 11.4% share of nonfarm jobs.
For the pandemic recovery period, the preliminary nonfarm job numbers through December 2023 had California at a net increase of 508,100. Even incorporating the January 2024 results, the revised numbers show the California economy expanding by only 330,000 jobs since the pre-pandemic peak, or an annual average growth rate of only 0.6% since February 2020.
Employment Down/Unemployment Up . . . Again
The labor force numbers also show continued weakness in the number of workers being employed in the state. The annual revisions to seasonally adjusted employment released March 1 in general showed employment lower than previously reported, but the changes were also generally lower than the job number adjustments.
In January, seasonally adjusted employment dropped by 8,000, while the number of unemployed rose 23,300. As a result, the unemployment rate grew by 0.1 point to 5.2%, the highest since January 2022. Under the revised numbers, employment has dropped in 7 of the last 8 months, and the number of unemployed has increased in 15 of the last 16 months. Over the year since January 2023, employment was off by 48,900, and unemployment was up by 155,800.
California Labor Force 5.2% CA Unemployment
Rate
California's reported unemployment rate (seasonally adjusted) in January was up 0.1 point to 5.2% as employment showed little change and unemployment continued to increase. The US rate was unchanged at 3.7%.
-8.0k CA Employment
Employment dipped by 8,000 (seasonally adjusted), adding to a total loss since June of 96,200.
US employment dipped by 31,000 in January.
California unemployment rose 23,300, while US unemployment dropped 144,000.
Nonfarm Jobs by Region
In spite of continuing tech industry layoffs, the Bay Area again posted a positive jobs growth in January, and Los Angeles Region again showed higher jobs numbers. Under the revised numbers, however, neither region along with Orange has recovered from the pandemic era job losses.
Because the data in the table is seasonally adjusted, the numbers should be considered as the total for the counties in each region rather than the regional number. This job series also is not available for all areas in California.
Counties with Double-Digit Unemployment 7 Counties with
Unemployment Above
10%
The number of counties with an unemployment rate (not seasonally adjusted) at 10% or more increased to 7. The unadjusted rates ranged from 3.7% in San Mateo to 19.3% in Colusa.
Unemployment Rate by Legislative District
The estimated unemployment rates are shown below for the highest and lowest districts. The full data and methodology are available on the Center’s website.
The California Center for Jobs and the Economy provides an objective and definitive source of information pertaining to job creation and economic trends in California. [[link removed]] Contact 1301 I Street Sacramento, CA 95814 916.553.4093 If you no longer wish to receive these emails, select here to unsubscribe. [link removed]
Message Analysis
- Sender: California Center for Jobs and the Economy
- Political Party: n/a
- Country: United States
- State/Locality: California
- Office: n/a
-
Email Providers:
- Campaign Monitor