| From | Center for Jobs and the Economy <[email protected]> |
| Subject | California Trade Report for November 2023 |
| Date | January 10, 2024 11:00 PM |
Links have been removed from this email. Learn more in the FAQ.
Links have been removed from this email. Learn more in the FAQ.
Web Version [link removed] | Update Preferences [link removed] [link removed] California Trade Report
for November 2023
Below are highlights from the recently released trade data from the US Census Bureau and US Bureau of Economic Analysis. To view additional data and analysis related to the California economy visit our website at [[link removed]].
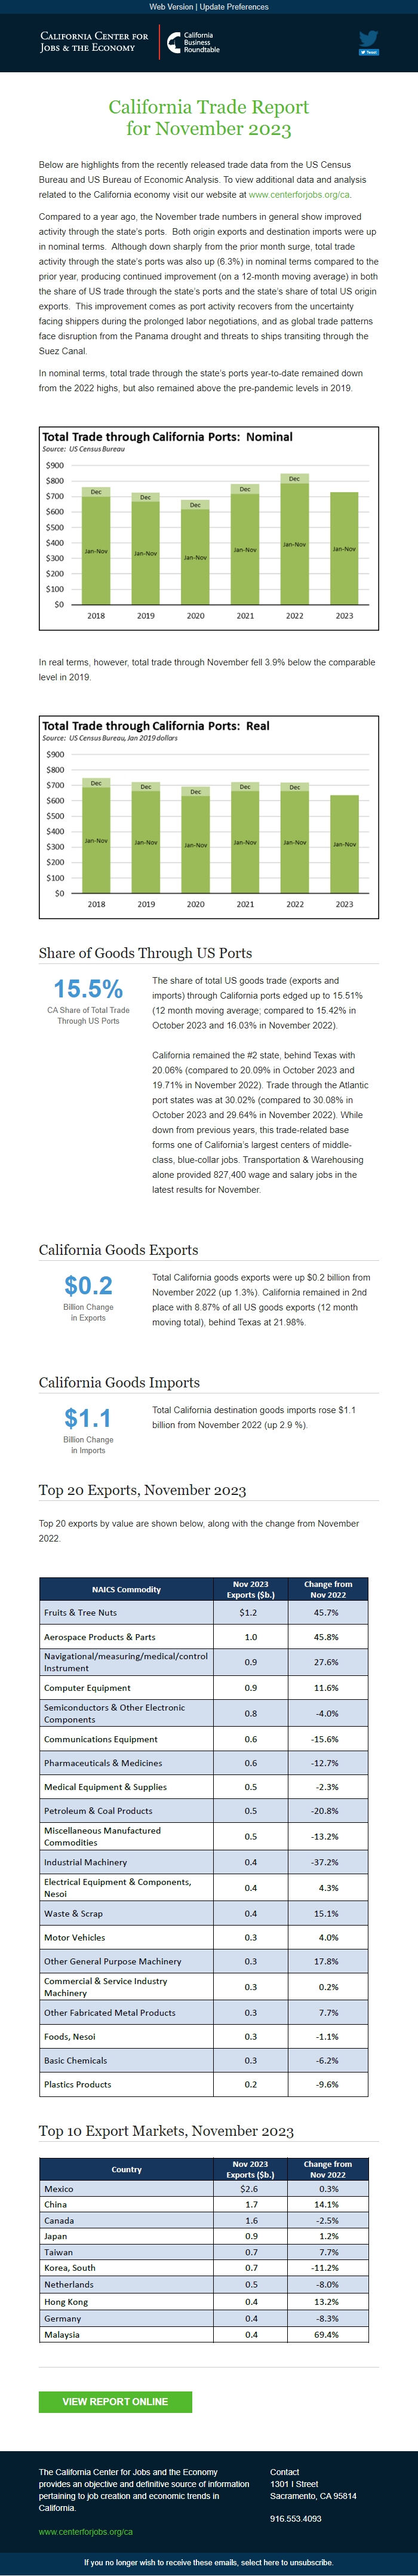
Compared to a year ago, the November trade numbers in general show improved activity through the state’s ports. Both origin exports and destination imports were up in nominal terms. Although down sharply from the prior month surge, total trade activity through the state’s ports was also up (6.3%) in nominal terms compared to the prior year, producing continued improvement (on a 12-month moving average) in both the share of US trade through the state’s ports and the state’s share of total US origin exports. This improvement comes as port activity recovers from the uncertainty facing shippers during the prolonged labor negotiations, and as global trade patterns face disruption from the Panama drought and threats to ships transiting through the Suez Canal.
In nominal terms, total trade through the state’s ports year-to-date remained down from the 2022 highs, but also remained above the pre-pandemic levels in 2019.
In real terms, however, total trade through November fell 3.9% below the comparable level in 2019.
Share of Goods Through US Ports 15.5% CA Share of Total Trade
Through US Ports
The share of total US goods trade (exports and imports) through California ports edged up to 15.51% (12 month moving average; compared to 15.42% in October 2023 and 16.03% in November 2022).
California remained the #2 state, behind Texas with 20.06% (compared to 20.09% in October 2023 and 19.71% in November 2022). Trade through the Atlantic port states was at 30.02% (compared to 30.08% in October 2023 and 29.64% in November 2022). While down from previous years, this trade-related base forms one of California’s largest centers of middle-class, blue-collar jobs. Transportation & Warehousing alone provided 827,400 wage and salary jobs in the latest results for November.
California Goods Exports $0.2 Billion Change
in Exports
Total California goods exports were up $0.2 billion from November 2022 (up 1.3%). California remained in 2nd place with 8.87% of all US goods exports (12 month moving total), behind Texas at 21.98%.
California Goods Imports $1.1 Billion Change
in Imports
Total California destination goods imports rose $1.1 billion from November 2022 (up 2.9 %).
Top 20 Exports, November 2023
Top 20 exports by value are shown below, along with the change from November 2022.
Top 10 Export Markets, November 2023 View Report Online [[link removed]] The California Center for Jobs and the Economy provides an objective and definitive source of information pertaining to job creation and economic trends in California. [[link removed]] Contact 1301 I Street Sacramento, CA 95814 916.553.4093 If you no longer wish to receive these emails, select here to unsubscribe. [link removed]
for November 2023
Below are highlights from the recently released trade data from the US Census Bureau and US Bureau of Economic Analysis. To view additional data and analysis related to the California economy visit our website at [[link removed]].
Compared to a year ago, the November trade numbers in general show improved activity through the state’s ports. Both origin exports and destination imports were up in nominal terms. Although down sharply from the prior month surge, total trade activity through the state’s ports was also up (6.3%) in nominal terms compared to the prior year, producing continued improvement (on a 12-month moving average) in both the share of US trade through the state’s ports and the state’s share of total US origin exports. This improvement comes as port activity recovers from the uncertainty facing shippers during the prolonged labor negotiations, and as global trade patterns face disruption from the Panama drought and threats to ships transiting through the Suez Canal.
In nominal terms, total trade through the state’s ports year-to-date remained down from the 2022 highs, but also remained above the pre-pandemic levels in 2019.
In real terms, however, total trade through November fell 3.9% below the comparable level in 2019.
Share of Goods Through US Ports 15.5% CA Share of Total Trade
Through US Ports
The share of total US goods trade (exports and imports) through California ports edged up to 15.51% (12 month moving average; compared to 15.42% in October 2023 and 16.03% in November 2022).
California remained the #2 state, behind Texas with 20.06% (compared to 20.09% in October 2023 and 19.71% in November 2022). Trade through the Atlantic port states was at 30.02% (compared to 30.08% in October 2023 and 29.64% in November 2022). While down from previous years, this trade-related base forms one of California’s largest centers of middle-class, blue-collar jobs. Transportation & Warehousing alone provided 827,400 wage and salary jobs in the latest results for November.
California Goods Exports $0.2 Billion Change
in Exports
Total California goods exports were up $0.2 billion from November 2022 (up 1.3%). California remained in 2nd place with 8.87% of all US goods exports (12 month moving total), behind Texas at 21.98%.
California Goods Imports $1.1 Billion Change
in Imports
Total California destination goods imports rose $1.1 billion from November 2022 (up 2.9 %).
Top 20 Exports, November 2023
Top 20 exports by value are shown below, along with the change from November 2022.
Top 10 Export Markets, November 2023 View Report Online [[link removed]] The California Center for Jobs and the Economy provides an objective and definitive source of information pertaining to job creation and economic trends in California. [[link removed]] Contact 1301 I Street Sacramento, CA 95814 916.553.4093 If you no longer wish to receive these emails, select here to unsubscribe. [link removed]
Message Analysis
- Sender: California Center for Jobs and the Economy
- Political Party: n/a
- Country: United States
- State/Locality: California
- Office: n/a
-
Email Providers:
- Campaign Monitor