| From | VPAP <[email protected]> |
| Subject | Visual: How Each Legislator Fared |
| Date | March 16, 2020 3:14 PM |
Links have been removed from this email. Learn more in the FAQ.
Links have been removed from this email. Learn more in the FAQ.
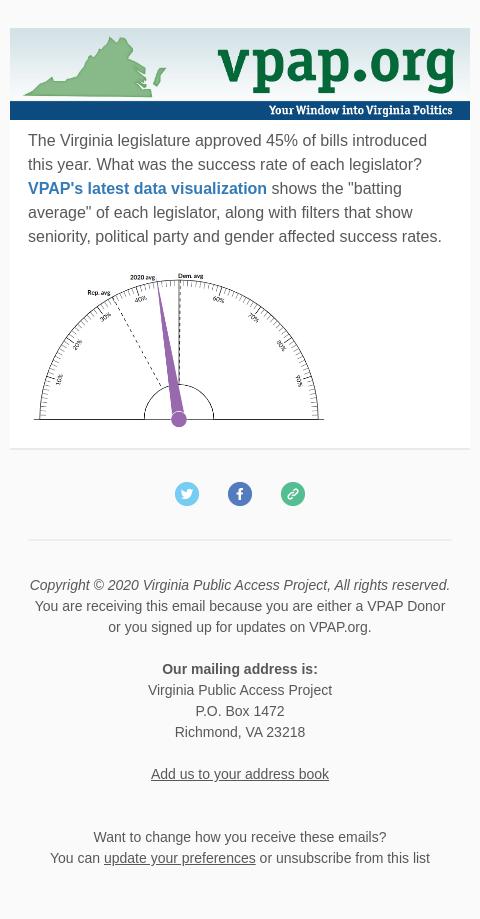
The Virginia legislature approved 45% of bills introduced this year. What was the success rate of each legislator? VPAP's latest data visualization ([link removed]) shows the "batting average" of each legislator, along with filters that show seniority, political party and gender affected success rates.
[link removed]
============================================================
** ([link removed])
** ([link removed])
** ([link removed])
Copyright © 2020 Virginia Public Access Project, All rights reserved.
You are receiving this email because you are either a VPAP Donor or you signed up for updates on VPAP.org.
Our mailing address is:
Virginia Public Access Project
P.O. Box 1472
Richmond, VA 23218
USA
Want to change how you receive these emails?
You can ** update your preferences ([link removed])
or ** unsubscribe from this list ([link removed])
Message Analysis
- Sender: Virginia Public Access Project (VPAP)
- Political Party: n/a
- Country: United States
- State/Locality: Virginia
- Office: n/a
-
Email Providers:
- MailChimp