| From | Center for Jobs and the Economy <[email protected]> |
| Subject | California Trade Report for August 2023 |
| Date | October 10, 2023 6:30 PM |
Links have been removed from this email. Learn more in the FAQ.
Links have been removed from this email. Learn more in the FAQ.
Web Version [link removed] | Update Preferences [link removed] [link removed] California Trade Report
for August 2023
Below are highlights from the recently released trade data from the US Census Bureau and US Bureau of Economic Analysis. To view additional data and analysis related to the California economy visit our website at [[link removed]].
With the West Coast labor situation resolved, the ports can now turn their attention to regaining lost traffic and the associated blue collar and related jobs that rely on this activity. Unfortunately, moving beyond this point also means the ports must now focus on other threats to this core jobs base, including the continued rise in operating costs especially energy and new regulatory threats [[link removed]] that would place a cap on allowable port activity in the state.
The August trade results show a weakening in trade activity, reflecting both the challenges to trade in the state along with overall softening in the global trade numbers. In nominal terms, origin exports were down 6.2% from August 2022, destination imports down 10.7%, and overall trade through the state’s ports off 7.8%. Year-to-date, however, total trade through the state’s ports has been somewhat higher than the pre-pandemic years, although lower than the same period in 2022.
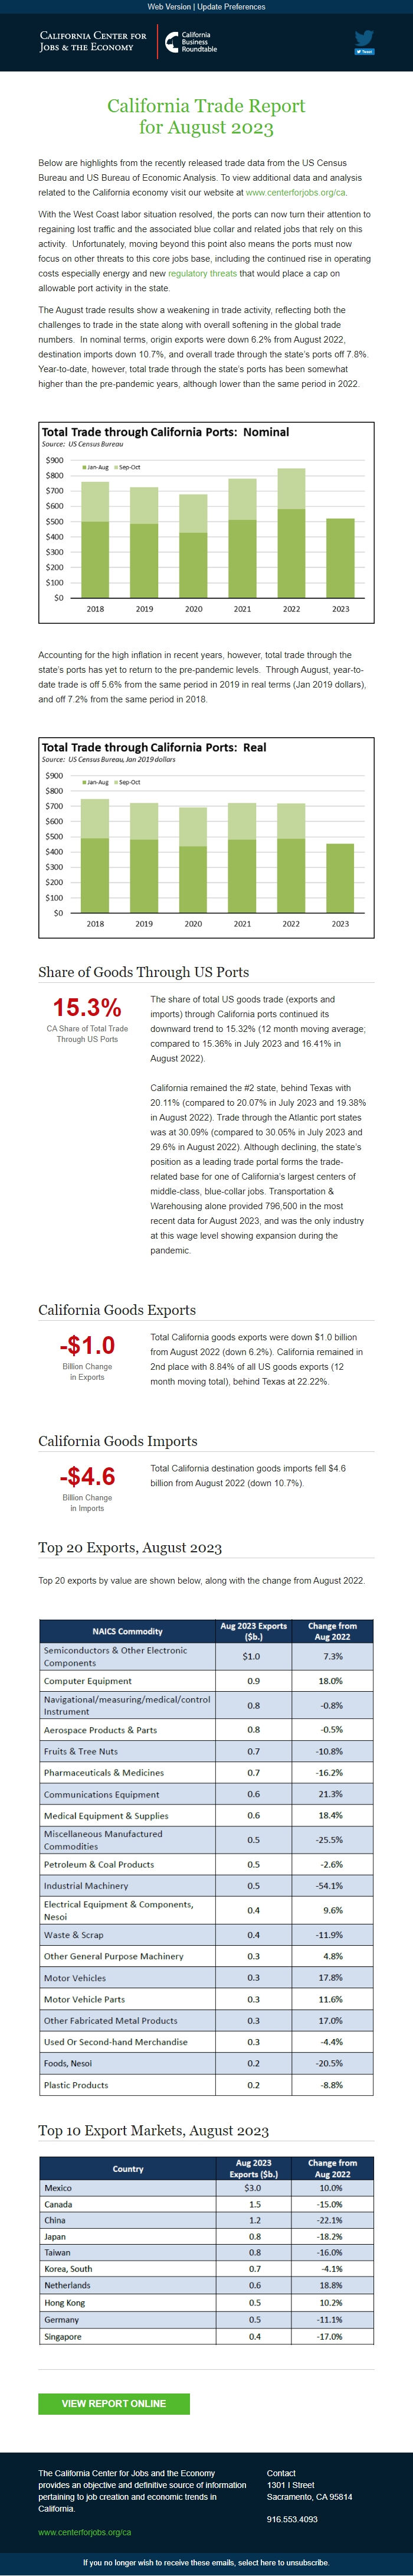
Accounting for the high inflation in recent years, however, total trade through the state’s ports has yet to return to the pre-pandemic levels. Through August, year-to-date trade is off 5.6% from the same period in 2019 in real terms (Jan 2019 dollars), and off 7.2% from the same period in 2018.
Share of Goods Through US Ports 15.3% CA Share of Total Trade
Through US Ports
The share of total US goods trade (exports and imports) through California ports continued its downward trend to 15.32% (12 month moving average; compared to 15.36% in July 2023 and 16.41% in August 2022).
California remained the #2 state, behind Texas with 20.11% (compared to 20.07% in July 2023 and 19.38% in August 2022). Trade through the Atlantic port states was at 30.09% (compared to 30.05% in July 2023 and 29.6% in August 2022). Although declining, the state’s position as a leading trade portal forms the trade-related base for one of California’s largest centers of middle-class, blue-collar jobs. Transportation & Warehousing alone provided 796,500 in the most recent data for August 2023, and was the only industry at this wage level showing expansion during the pandemic.
California Goods Exports -$1.0 Billion Change
in Exports
Total California goods exports were down $1.0 billion from August 2022 (down 6.2%). California remained in 2nd place with 8.84% of all US goods exports (12 month moving total), behind Texas at 22.22%.
California Goods Imports -$4.6 Billion Change
in Imports
Total California destination goods imports fell $4.6 billion from August 2022 (down 10.7%).
Top 20 Exports, August 2023
Top 20 exports by value are shown below, along with the change from August 2022.
Top 10 Export Markets, August 2023 View Report Online [[link removed]] The California Center for Jobs and the Economy provides an objective and definitive source of information pertaining to job creation and economic trends in California. [[link removed]] Contact 1301 I Street Sacramento, CA 95814 916.553.4093 If you no longer wish to receive these emails, select here to unsubscribe. [link removed]
for August 2023
Below are highlights from the recently released trade data from the US Census Bureau and US Bureau of Economic Analysis. To view additional data and analysis related to the California economy visit our website at [[link removed]].
With the West Coast labor situation resolved, the ports can now turn their attention to regaining lost traffic and the associated blue collar and related jobs that rely on this activity. Unfortunately, moving beyond this point also means the ports must now focus on other threats to this core jobs base, including the continued rise in operating costs especially energy and new regulatory threats [[link removed]] that would place a cap on allowable port activity in the state.
The August trade results show a weakening in trade activity, reflecting both the challenges to trade in the state along with overall softening in the global trade numbers. In nominal terms, origin exports were down 6.2% from August 2022, destination imports down 10.7%, and overall trade through the state’s ports off 7.8%. Year-to-date, however, total trade through the state’s ports has been somewhat higher than the pre-pandemic years, although lower than the same period in 2022.
Accounting for the high inflation in recent years, however, total trade through the state’s ports has yet to return to the pre-pandemic levels. Through August, year-to-date trade is off 5.6% from the same period in 2019 in real terms (Jan 2019 dollars), and off 7.2% from the same period in 2018.
Share of Goods Through US Ports 15.3% CA Share of Total Trade
Through US Ports
The share of total US goods trade (exports and imports) through California ports continued its downward trend to 15.32% (12 month moving average; compared to 15.36% in July 2023 and 16.41% in August 2022).
California remained the #2 state, behind Texas with 20.11% (compared to 20.07% in July 2023 and 19.38% in August 2022). Trade through the Atlantic port states was at 30.09% (compared to 30.05% in July 2023 and 29.6% in August 2022). Although declining, the state’s position as a leading trade portal forms the trade-related base for one of California’s largest centers of middle-class, blue-collar jobs. Transportation & Warehousing alone provided 796,500 in the most recent data for August 2023, and was the only industry at this wage level showing expansion during the pandemic.
California Goods Exports -$1.0 Billion Change
in Exports
Total California goods exports were down $1.0 billion from August 2022 (down 6.2%). California remained in 2nd place with 8.84% of all US goods exports (12 month moving total), behind Texas at 22.22%.
California Goods Imports -$4.6 Billion Change
in Imports
Total California destination goods imports fell $4.6 billion from August 2022 (down 10.7%).
Top 20 Exports, August 2023
Top 20 exports by value are shown below, along with the change from August 2022.
Top 10 Export Markets, August 2023 View Report Online [[link removed]] The California Center for Jobs and the Economy provides an objective and definitive source of information pertaining to job creation and economic trends in California. [[link removed]] Contact 1301 I Street Sacramento, CA 95814 916.553.4093 If you no longer wish to receive these emails, select here to unsubscribe. [link removed]
Message Analysis
- Sender: California Center for Jobs and the Economy
- Political Party: n/a
- Country: United States
- State/Locality: California
- Office: n/a
-
Email Providers:
- Campaign Monitor