| From | Callum Purves <[email protected]> |
| Subject | Our 2023 Ratepayers' Report is live |
| Date | August 3, 2023 2:34 AM |
Links have been removed from this email. Learn more in the FAQ.
Links have been removed from this email. Learn more in the FAQ.
Dear Friend,
The 2023 Ratepayers' Report is now live!
As you may have caught on the news, today we released the 2023 edition of our popular Ratepayers' Report New Zealand's local government league tables, produced in partnership with the Auckland Ratepayers' Alliance.
Ratepayers' Report shows how your local council is performing on measures such as average residential rates, liabilities, staffing costs, third party payments and more.
--> Click here to find out how your council compares <[link removed]>
Once logged in, you can view the rankings for different councils by ratios by clicking the Comparison Chart at the top right.
These are some of the key figures about which councils are preforming well and which need to brush up their act.
Key findings
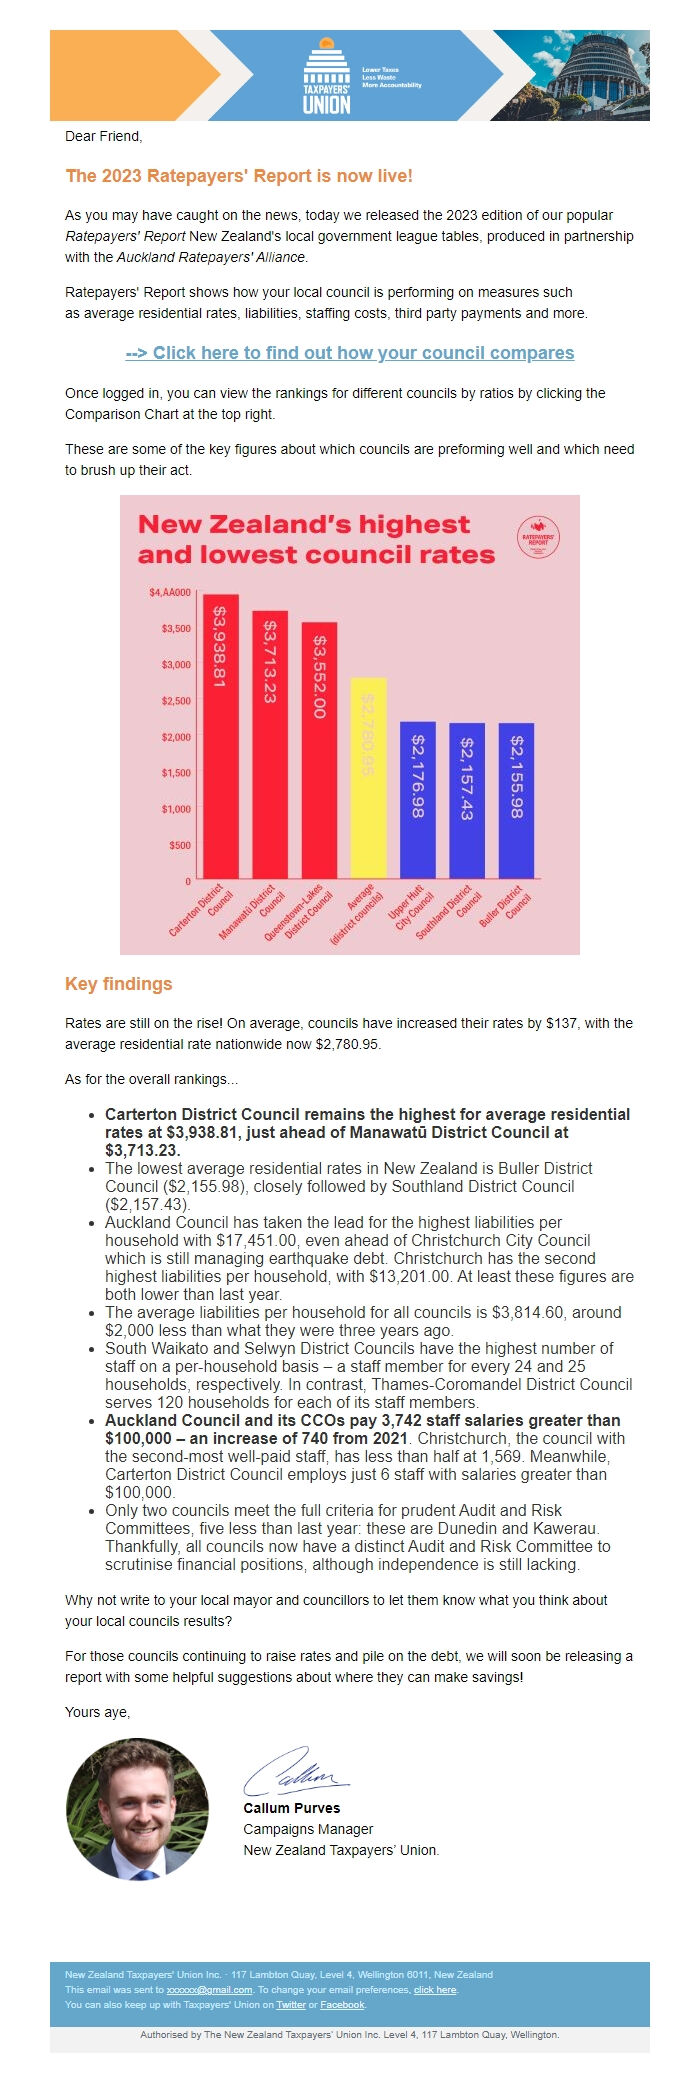
Rates are still on the rise! On average, councils have increased their rates by $137, with the average residential rate nationwide now $2,780.95.
As for the overall rankings...
- Carterton District Council remains the highest for average residential rates at $3,938.81, just ahead of Manawatū District Council at $3,713.23.
- The lowest average residential rates in New Zealand is Buller District Council ($2,155.98), closely followed by Southland District Council ($2,157.43).
- Auckland Council has taken the lead for the highest liabilities per household with $17,451.00, even ahead of Christchurch City Council which is still managing earthquake debt. Christchurch has the second highest liabilities per household, with $13,201.00. At least these figures are both lower than last year.
- The average liabilities per household for all councils is $3,814.60, around $2,000 less than what they were three years ago.
- South Waikato and Selwyn District Councils have the highest number of staff on a per-household basis – a staff member for every 24 and 25 households, respectively. In contrast, Thames-Coromandel District Council serves 120 households for each of its staff members.
- Auckland Council and its CCOs pay 3,742 staff salaries greater than $100,000 – an increase of 740 from 2021. Christchurch, the council with the second-most well-paid staff, has less than half at 1,569. Meanwhile, Carterton District Council employs just 6 staff with salaries greater than $100,000.
- Only two councils meet the full criteria for prudent Audit and Risk Committees, five less than last year: these are Dunedin and Kawerau. Thankfully, all councils now have a distinct Audit and Risk Committee to scrutinise financial positions, although independence is still lacking.
Why not write to your local mayor and councillors to let them know what you think about your local councils results?
For those councils continuing to raise rates and pile on the debt, we will soon be releasing a report with some helpful suggestions about where they can make savings!
Yours aye,
Callum Purves
Campaigns Manager
New Zealand Taxpayers’ Union.
-=-=-
New Zealand Taxpayers' Union Inc. - 117 Lambton Quay, Level 4, Wellington 6011, New Zealand
This email was sent to [email protected]. To stop receiving emails: [link removed]
-=-=-
Created with NationBuilder - [link removed]
The 2023 Ratepayers' Report is now live!
As you may have caught on the news, today we released the 2023 edition of our popular Ratepayers' Report New Zealand's local government league tables, produced in partnership with the Auckland Ratepayers' Alliance.
Ratepayers' Report shows how your local council is performing on measures such as average residential rates, liabilities, staffing costs, third party payments and more.
--> Click here to find out how your council compares <[link removed]>
Once logged in, you can view the rankings for different councils by ratios by clicking the Comparison Chart at the top right.
These are some of the key figures about which councils are preforming well and which need to brush up their act.
Key findings
Rates are still on the rise! On average, councils have increased their rates by $137, with the average residential rate nationwide now $2,780.95.
As for the overall rankings...
- Carterton District Council remains the highest for average residential rates at $3,938.81, just ahead of Manawatū District Council at $3,713.23.
- The lowest average residential rates in New Zealand is Buller District Council ($2,155.98), closely followed by Southland District Council ($2,157.43).
- Auckland Council has taken the lead for the highest liabilities per household with $17,451.00, even ahead of Christchurch City Council which is still managing earthquake debt. Christchurch has the second highest liabilities per household, with $13,201.00. At least these figures are both lower than last year.
- The average liabilities per household for all councils is $3,814.60, around $2,000 less than what they were three years ago.
- South Waikato and Selwyn District Councils have the highest number of staff on a per-household basis – a staff member for every 24 and 25 households, respectively. In contrast, Thames-Coromandel District Council serves 120 households for each of its staff members.
- Auckland Council and its CCOs pay 3,742 staff salaries greater than $100,000 – an increase of 740 from 2021. Christchurch, the council with the second-most well-paid staff, has less than half at 1,569. Meanwhile, Carterton District Council employs just 6 staff with salaries greater than $100,000.
- Only two councils meet the full criteria for prudent Audit and Risk Committees, five less than last year: these are Dunedin and Kawerau. Thankfully, all councils now have a distinct Audit and Risk Committee to scrutinise financial positions, although independence is still lacking.
Why not write to your local mayor and councillors to let them know what you think about your local councils results?
For those councils continuing to raise rates and pile on the debt, we will soon be releasing a report with some helpful suggestions about where they can make savings!
Yours aye,
Callum Purves
Campaigns Manager
New Zealand Taxpayers’ Union.
-=-=-
New Zealand Taxpayers' Union Inc. - 117 Lambton Quay, Level 4, Wellington 6011, New Zealand
This email was sent to [email protected]. To stop receiving emails: [link removed]
-=-=-
Created with NationBuilder - [link removed]
Message Analysis
- Sender: Taxpayers’ Union
- Political Party: n/a
- Country: New Zealand
- State/Locality: n/a
- Office: n/a
-
Email Providers:
- NationBuilder