| From | Center for Jobs and the Economy <[email protected]> |
| Subject | California Trade Report for April 2023 |
| Date | June 8, 2023 10:52 PM |
Links have been removed from this email. Learn more in the FAQ.
Links have been removed from this email. Learn more in the FAQ.
Web Version [link removed] | Update Preferences [link removed] [link removed] California Trade Report
for April 2023
Below are highlights from the recently released trade data from the US Census Bureau and US Bureau of Economic Analysis. To view additional data and analysis related to the California economy visit our website at [[link removed]].
The April data in general indicates a slowing in trade activity for the state. Total trade through the state’s ports was down 12.0% compared to April 2022, while the share of US goods trade through California (measured as a 12-month moving average) continued a 25-month long decline. In real terms, origin exports were off 9% from pre-pandemic April 2019, although destination imports were essentially level.
The slowing trade activity reflects the general slowing in the economy combined with shipper concerns over the extended port labor negotiations along with the increasing costs coming from state regulations. These concerns were likely accelerated following labor actions shutting down port activity in the San Pedro Bay ports [[link removed]], Port Hueneme [[link removed]], and Oakland [[link removed]].
The April data also includes the annual data revisions, in this instance revising data beginning in 2018. For California, these updates indicate total origin exports in 2020-22 were $616 million (0.12%) lower than previously reported, while destination imports were $614 million (0.04%) higher. The full data revisions are available through the Center’s website.
Share of Goods Through US Ports 15.5% CA Share of Total Trade
Through US Ports
The share of total US goods trade (exports and imports) through California ports continued its decline to 15.51% in April (12 month moving average; compared to 15.57% in March 2023 and 16.74% in April 2022).
California remained the #2 state, behind Texas with 20.11% (compared to 20.08% in March 2023 and 18.69% in April 2022). Trade through the Atlantic port states was at 29.8% (compared to 29.73% in March 2023 and 29.82% in April 2022). While now firmly in second place, the state’s position in this area forms the trade-related base for one of California’s largest centers of middle-class, blue-collar jobs. Transportation & Warehousing alone provided 793,800 wage and salary jobs in the most recent data for April.
California Goods Exports -$1.7 Billion Change
in Exports
Total California goods exports were down $1.7 billion from April 2022 (down 10.5%). California remained in 2nd place as its share also continued declining to 8.82% of all US goods exports (12 month moving total), behind Texas at 23.0%.
California Goods Imports -$6.7 Billion Change
in Imports
Total California destination goods imports dropped $6.7 billion from April 2022 (down 15.8%).
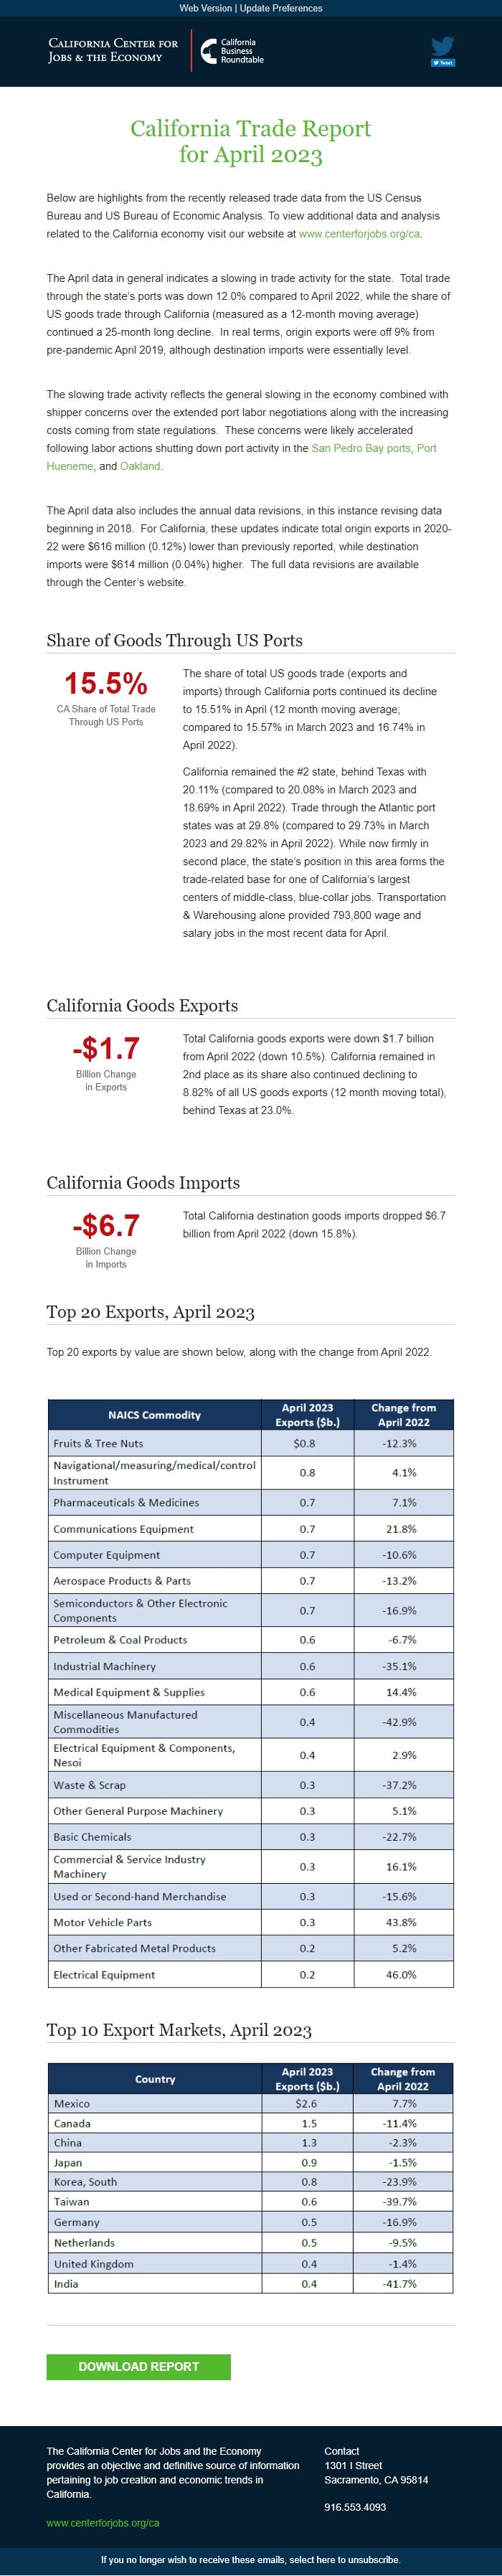
Top 20 Exports, April 2023
Top 20 exports by value are shown below, along with the change from April 2022.
Top 10 Export Markets, April 2023 Download report [[link removed]] The California Center for Jobs and the Economy provides an objective and definitive source of information pertaining to job creation and economic trends in California. [[link removed]] Contact 1301 I Street Sacramento, CA 95814 916.553.4093 If you no longer wish to receive these emails, select here to unsubscribe. [link removed]
for April 2023
Below are highlights from the recently released trade data from the US Census Bureau and US Bureau of Economic Analysis. To view additional data and analysis related to the California economy visit our website at [[link removed]].
The April data in general indicates a slowing in trade activity for the state. Total trade through the state’s ports was down 12.0% compared to April 2022, while the share of US goods trade through California (measured as a 12-month moving average) continued a 25-month long decline. In real terms, origin exports were off 9% from pre-pandemic April 2019, although destination imports were essentially level.
The slowing trade activity reflects the general slowing in the economy combined with shipper concerns over the extended port labor negotiations along with the increasing costs coming from state regulations. These concerns were likely accelerated following labor actions shutting down port activity in the San Pedro Bay ports [[link removed]], Port Hueneme [[link removed]], and Oakland [[link removed]].
The April data also includes the annual data revisions, in this instance revising data beginning in 2018. For California, these updates indicate total origin exports in 2020-22 were $616 million (0.12%) lower than previously reported, while destination imports were $614 million (0.04%) higher. The full data revisions are available through the Center’s website.
Share of Goods Through US Ports 15.5% CA Share of Total Trade
Through US Ports
The share of total US goods trade (exports and imports) through California ports continued its decline to 15.51% in April (12 month moving average; compared to 15.57% in March 2023 and 16.74% in April 2022).
California remained the #2 state, behind Texas with 20.11% (compared to 20.08% in March 2023 and 18.69% in April 2022). Trade through the Atlantic port states was at 29.8% (compared to 29.73% in March 2023 and 29.82% in April 2022). While now firmly in second place, the state’s position in this area forms the trade-related base for one of California’s largest centers of middle-class, blue-collar jobs. Transportation & Warehousing alone provided 793,800 wage and salary jobs in the most recent data for April.
California Goods Exports -$1.7 Billion Change
in Exports
Total California goods exports were down $1.7 billion from April 2022 (down 10.5%). California remained in 2nd place as its share also continued declining to 8.82% of all US goods exports (12 month moving total), behind Texas at 23.0%.
California Goods Imports -$6.7 Billion Change
in Imports
Total California destination goods imports dropped $6.7 billion from April 2022 (down 15.8%).
Top 20 Exports, April 2023
Top 20 exports by value are shown below, along with the change from April 2022.
Top 10 Export Markets, April 2023 Download report [[link removed]] The California Center for Jobs and the Economy provides an objective and definitive source of information pertaining to job creation and economic trends in California. [[link removed]] Contact 1301 I Street Sacramento, CA 95814 916.553.4093 If you no longer wish to receive these emails, select here to unsubscribe. [link removed]
Message Analysis
- Sender: California Center for Jobs and the Economy
- Political Party: n/a
- Country: United States
- State/Locality: California
- Office: n/a
-
Email Providers:
- Campaign Monitor